Straight Line Graphs
Although it is probably something you never really considered, a straight horizontal line drawn on a graph has the equation:
Where 'a' is a number. For example if we were to say that 'a' equals 5 then we could draw the simple horizontal line graph as shown below:
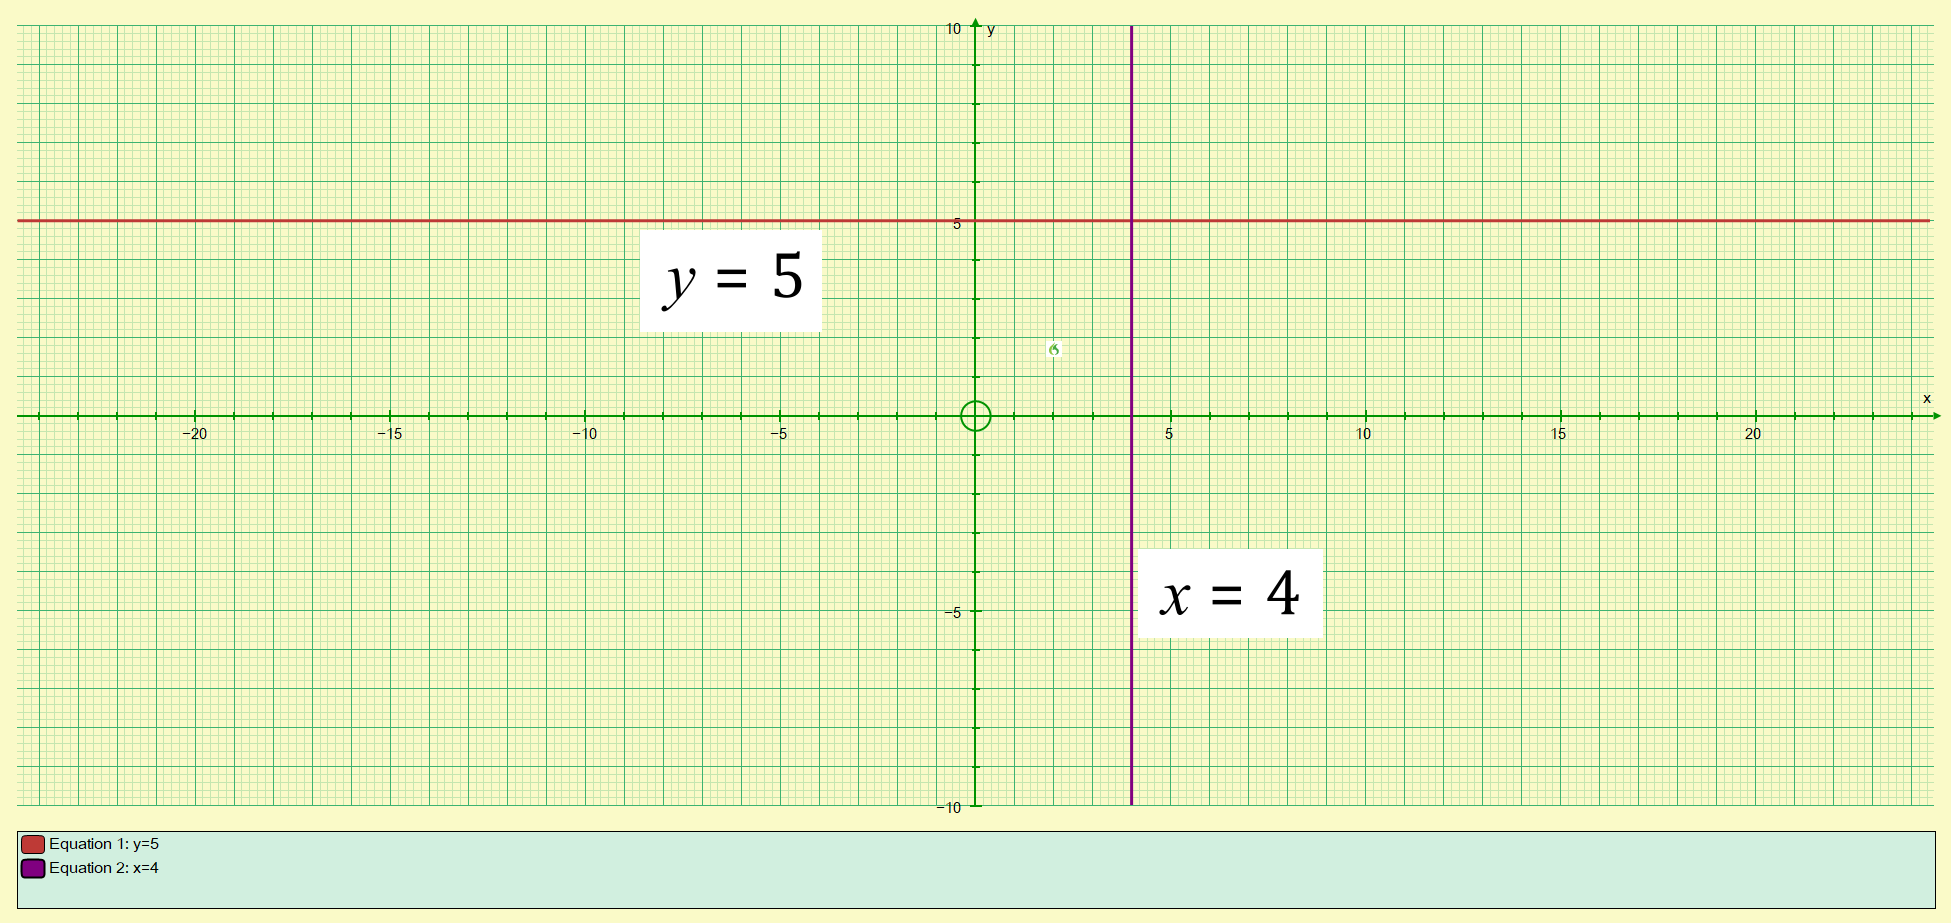
This is just a small section of the graph of "y = 5" as, for any value of X along the horizontal axis, the value for 'y' is fixed at 5, in this particular case the value for 'y' is not dependent on any value for 'x' because the variable 'x' does not appear in the equation. All horizontal lines on a graph have this equation, and the same can be said about all vertical lines on a graph which have the equation "x = b". If we consider 'x' to have the value of 4 this time we produce the rivetingly interesting straight-line vertical graph as shown above in purple..
Every point on the horizontal graph lies at 'y = 5' and every point on the vertical graph lies at 'x = 4' and this is invariant to infinity. Suffice it to say that such graphs are not particularly informative. Graphs of equations of a straight line which are not horizontal or vertical will contain values for both 'x' and 'y'. Usually these values will be obtained from a simple equation and plotted in a similar way to the example above, to produce a non-horizontal/non-vertical line which will have some interesting properties that we will talk about shortly.