The Graph of "y = mx + c"
The title of this topic will be explained shortly, but first of all let us take a look at a simple straight line graph, produced from a given equation where the values for 'y' and 'x' are tabulated from the equation.
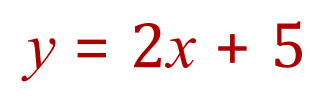
This is a fairly straightforward equation which will produce a straight line, we will now produce a table of values for 'y' and 'x' accordingly.
You can see that in this particular example all of the points lie in a straight line. If you simply study the equation along with the graph and pay particular attention to where the red line cuts the 'y' and the 'x' axes respectively you will probably spot that when 'x' equals zero, 2 'x' is also zero and the line intersects the y-axis at 5 which is the value of the constant in the equation.
Similarly, at the point where the red line crosses the x-axis, this represents a value when 'y' equals zero, and the value of 'x' which satisfies that particular circumstance is -2.5. This is also demonstrable by putting 2.5 into the equation as the value of 'x' whereupon you will indeed come back with an answer of zero.
We have explained how the 'constant' value of 5 is represented on the graph, but is there any significance with the coefficient of 'x', in this case 2? Well, if you look at the equation and explain it to yourself in words, you can say that for every value of 'x' that is used, a corresponding value of 'y' is produced by doubling 'x' and adding 5 (the constant).
Let us introduce a new expression, the "gradient" of the line, which is simply a measure of how 'steep' the line is. The 'steeper' the line, then the greater the 'gradient' will be, and the direction that the line slopes in (bottom left to top right, or top left to bottom right) will determine whether the gradient is positive or negative.
Let's take a look at this particular example to make this a bit clearer:
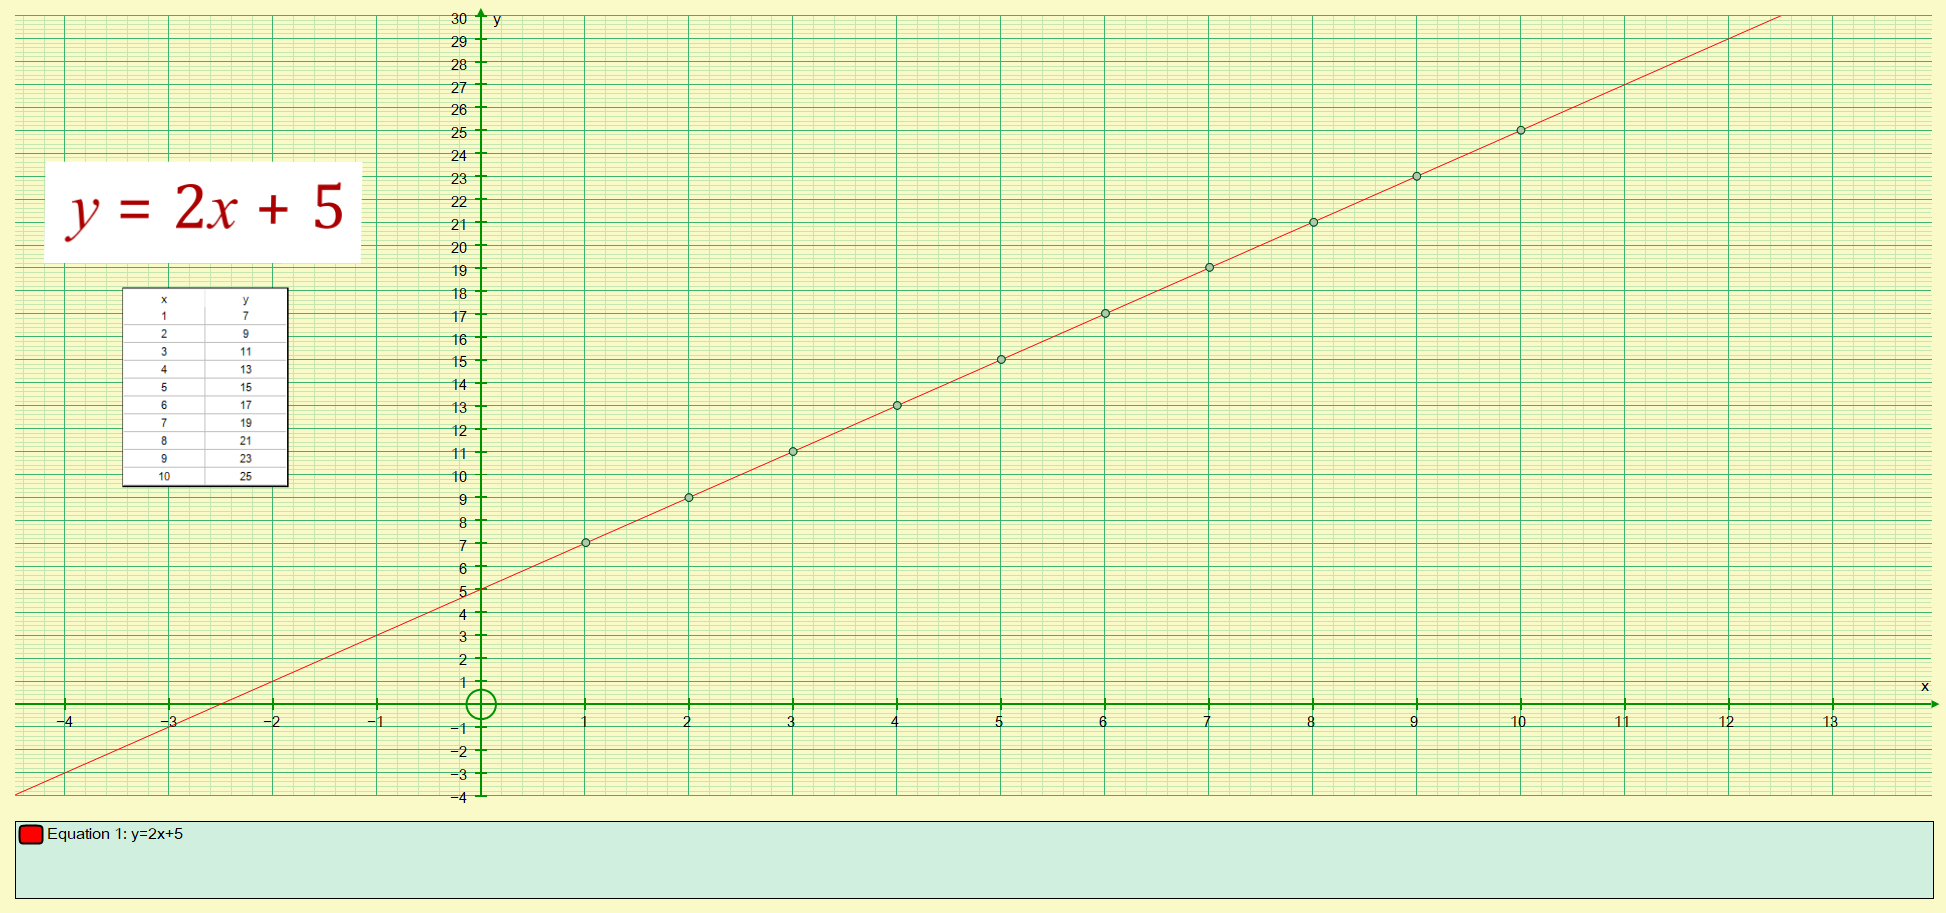
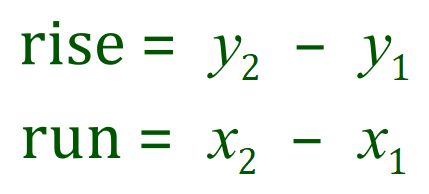
A small section taken from the above graph has been annotated with the "rise" and the "run" of the line. These two new terms allow us to evaluate the gradient of the line. Between two points we measure the slope of the line by dividing the amount by which it has "gone up" by how much it has "gone across", rather crudely explained but we are effectively dividing the "rise" by the "run".
In this particular case the rise evaluates to 8 and the run evaluates to 4 giving us a gradient of 2. This is where the "2" in "2x" comes from. In mathematics we call the gradient 'm' and the constant (where the line intercepts the y-axis) as 'c' and from this derive a generic equation for the graph a straight line as:
Graphs of equations which follow this pattern will always produce straight lines, the "rise" divided by the "run" will produce the gradient "m" for you and the intercept on the y-axis will produce the constant "c"
I mentioned previously that if the line sloped the other way then this would represent a negative gradient. Let's take a look at the short example just to confirm this.
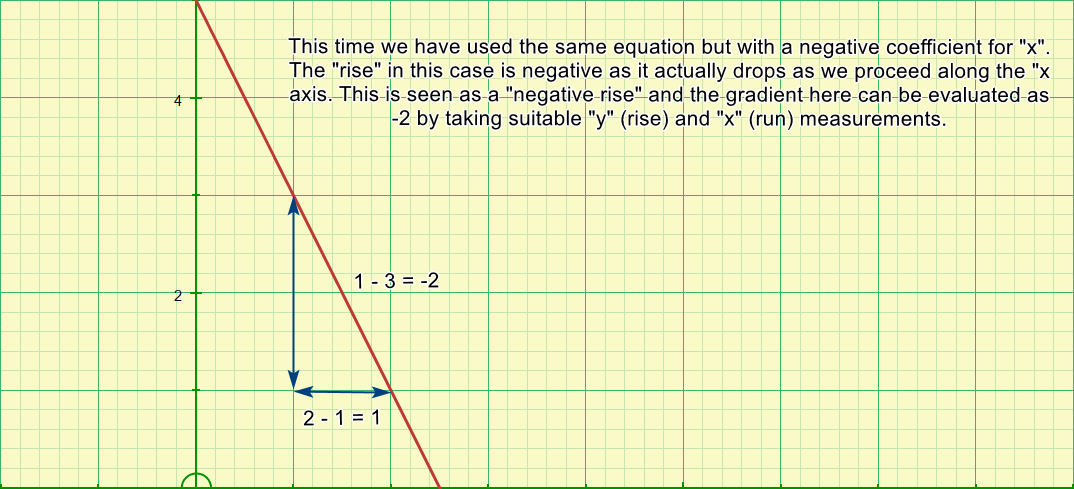
Remembering which way around is quite straightforward if we consider the first point to be x1y1 and the second point to be x2y2 where x2 is greater than x1:
If you consider this carefully you will see that the 'x' value is always going to be positive, it is only the 'y' value which can switch between positive and negative.
>> Questions <<