Graphing Quadratic Functions
Quadratic graphs involve those equations or expressions in terms of 'x' which contain an "x squared" term. The curve produced by the plotting of a quadratic function is parabolic and can be "U-shaped" or "N -shaped".
In just the same way as we did for straight-line graphs, if we have a quadratic equation/quadratic function we can produce a table of 'y' values for each corresponding 'x' value. Plotting these on a graph will produce an appropriate curve.
Let's take a look at a simple example:
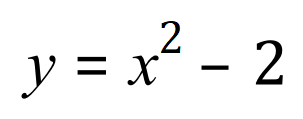
A simple quadratic expression for which values for 'y' can be calculated according to given values of 'x', subtracting 2 from the square of each value of 'x'.

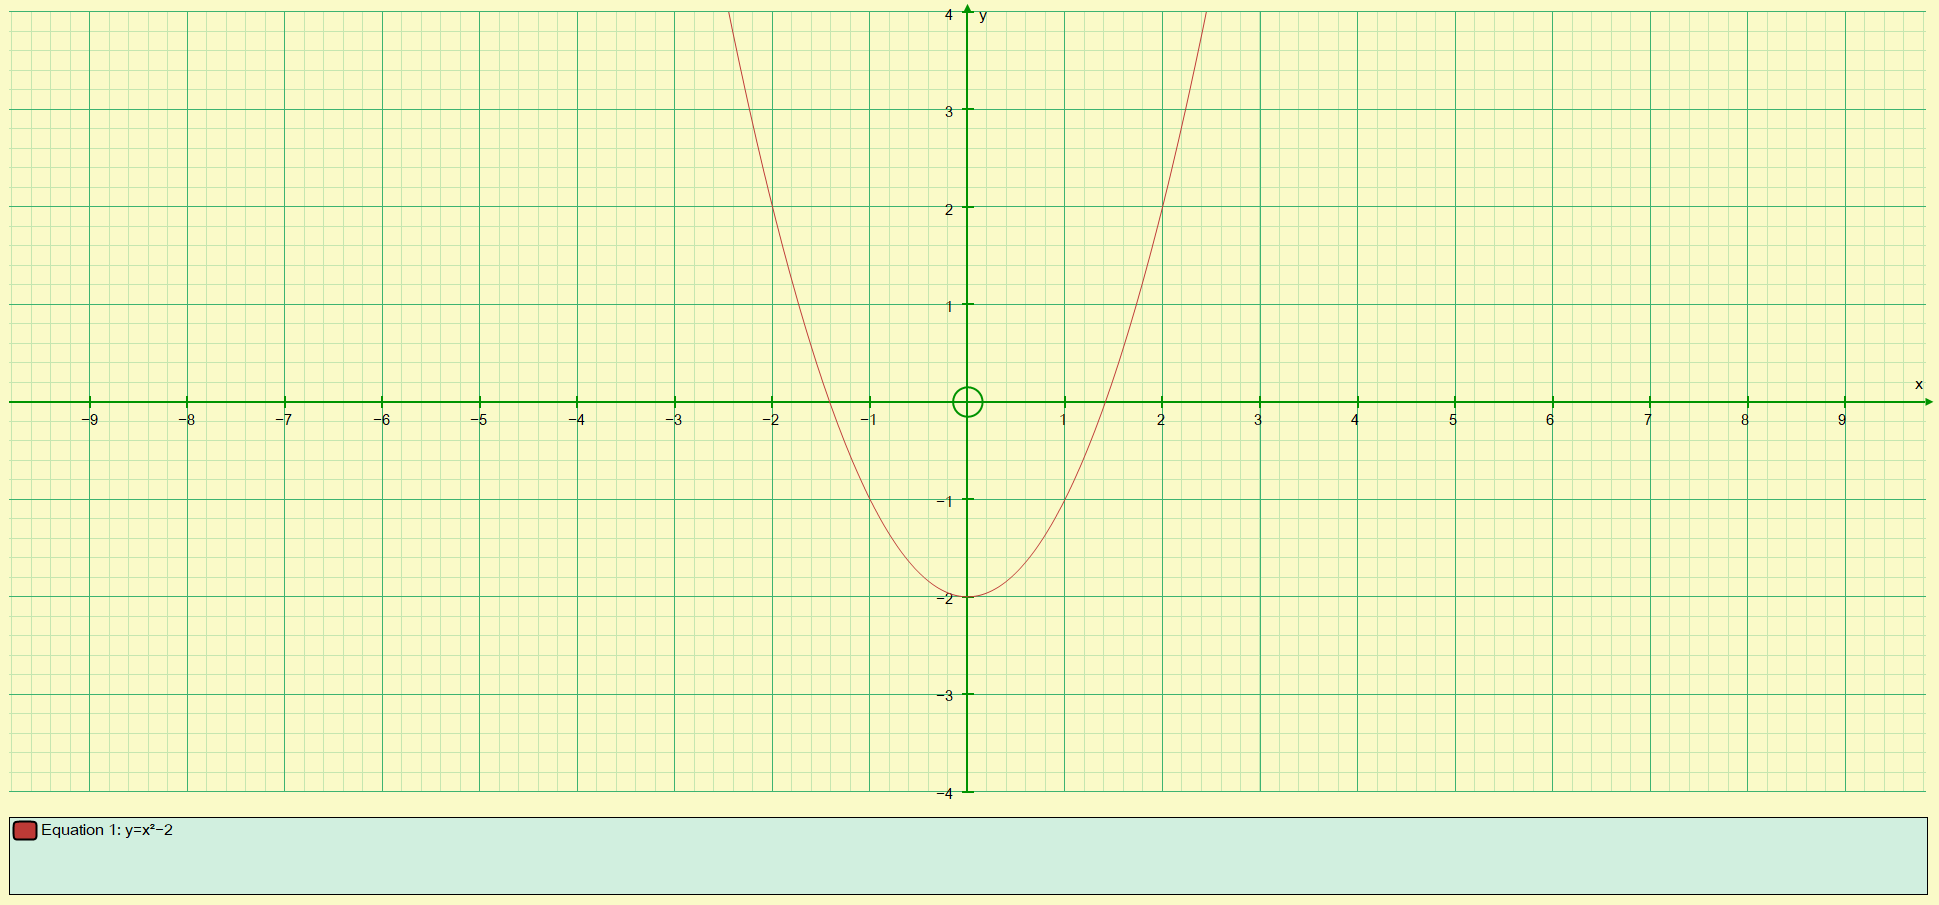
If you compare the table to the plotted curve, some of the points can easily be picked out, for example it is easy to see that when 'x' = +2 or 'x' = -2 the corresponding value of 'y' is +2.
Similarly when 'x' is zero, this leads to a value for 'y' of -2, again this is quite obvious on the curve. What is perhaps not quite so obvious are those values of 'x' which satisfy the quadratic expression itself, that is those values of 'x' which results in a value of zero for 'y'. These values are known as the "roots" of the quadratic expression and in this particular case, even from the graph, you can see that they are roughly +1.4 and -1.4.
If you cast your mind back to surds, you may remember that we talked quite a lot about the square root of 2, being an irrational number of 1.414 ......
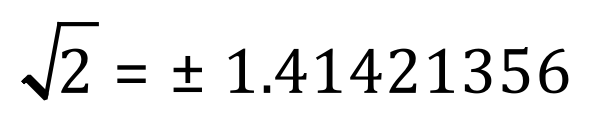
In fact, this calculation stops after 8 decimal places, but the number of decimal places is in fact infinite. The two square root values of 2 are in fact roots to the equation we have plotted above, and it is perhaps could point to mention that all positive integers have two square roots, a positive one and a negative one because if you square them both backup you will end up with the positive number you started with. So remember, that the next time you are asked what is the square root of 16 for example, you must quote +4 and -4 as your answer.
We mentioned above that the plot of a quadratic curve can be either U-shaped or N -shaped. Let's take a look at a quadratic function now which will produce an N-shaped curve.
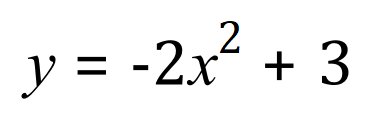

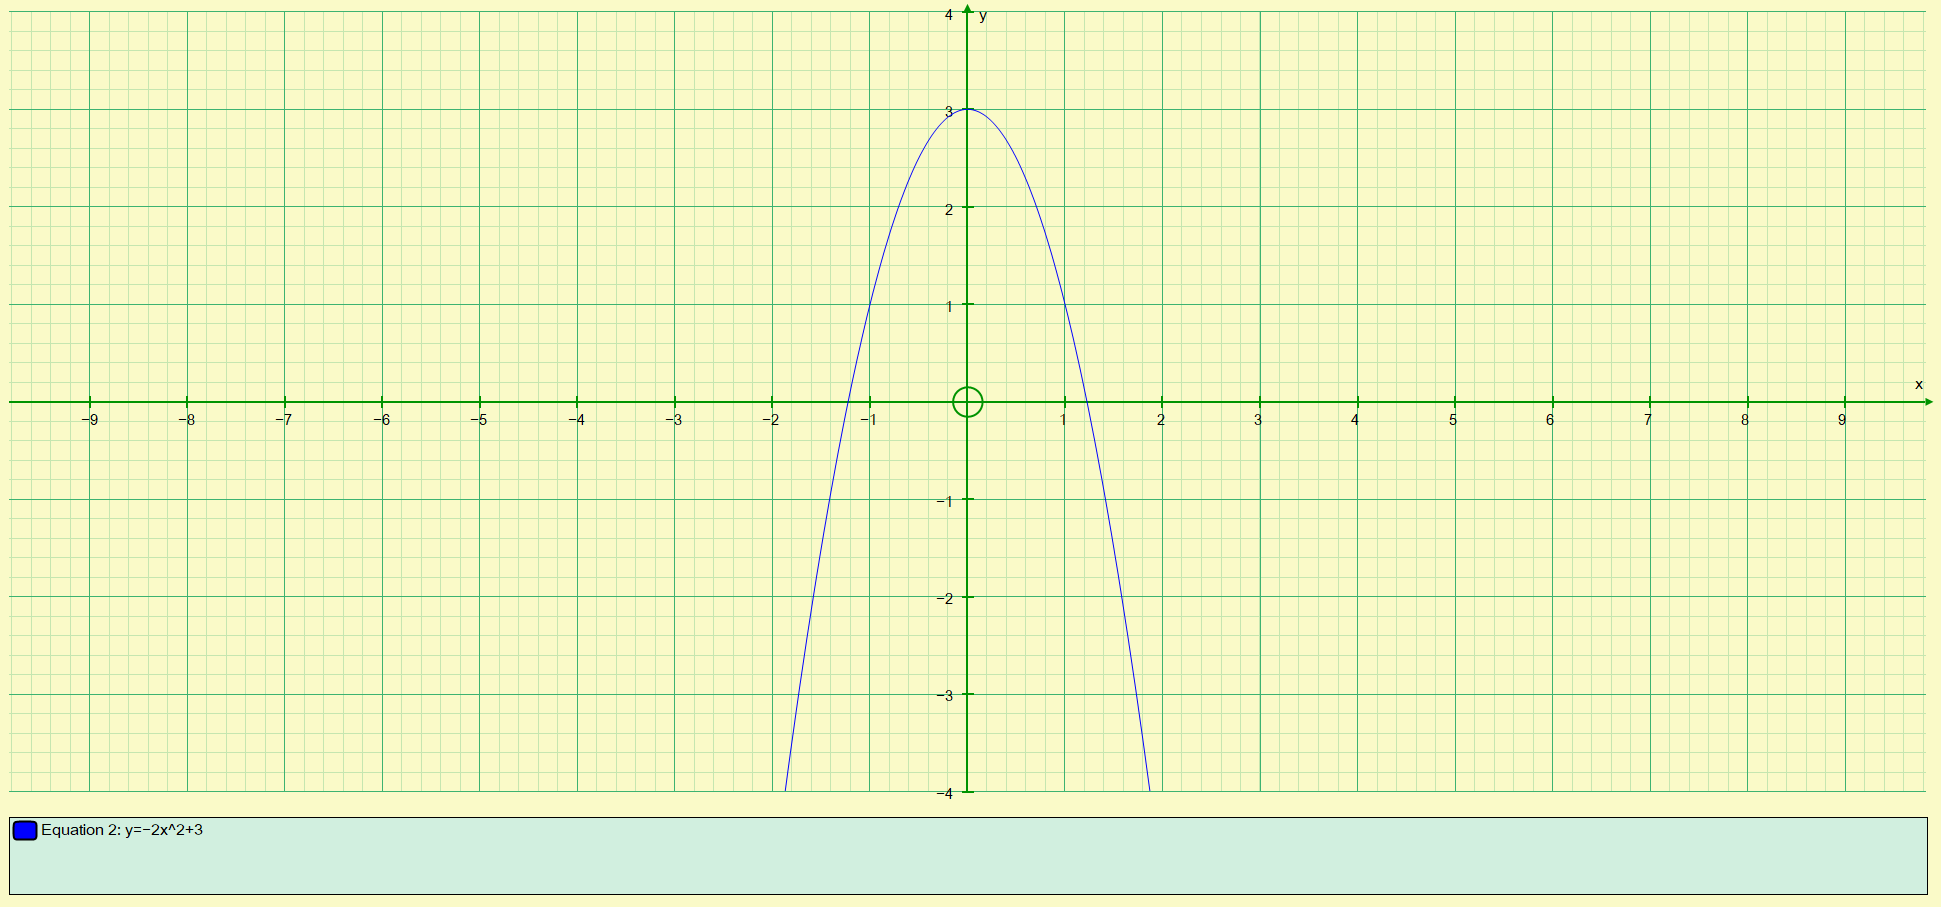
Although the values of 'y' are quite wide-ranging, I have chosen to show only that part of which we're interested in, that is where it crosses the 'x' and 'y' axes. Just as we saw in the previous example, some of the data points are quite easy to spot on the curve, for example the maximum point of the curve occurs when 'x' = 0, 'y' = 3. Of particular interest again are the 2 points at which the curve intersects with the 'x' axis. These points are the positive and negative roots of the quadratic expression and evaluate as:
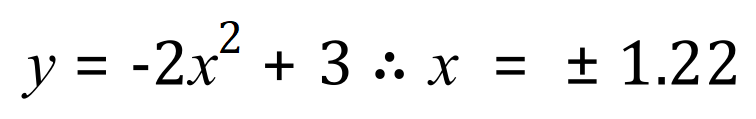
Using full calculator accuracy, the roots are in fact:
+ 1.2247448713915890490986420373529 and - 1.2247448713915890490986420373529 but even these are not exact. If we take a look at the expression and transform it in terms of 'x' we can in fact arrive at a surd value which, if quoted, would be exact:
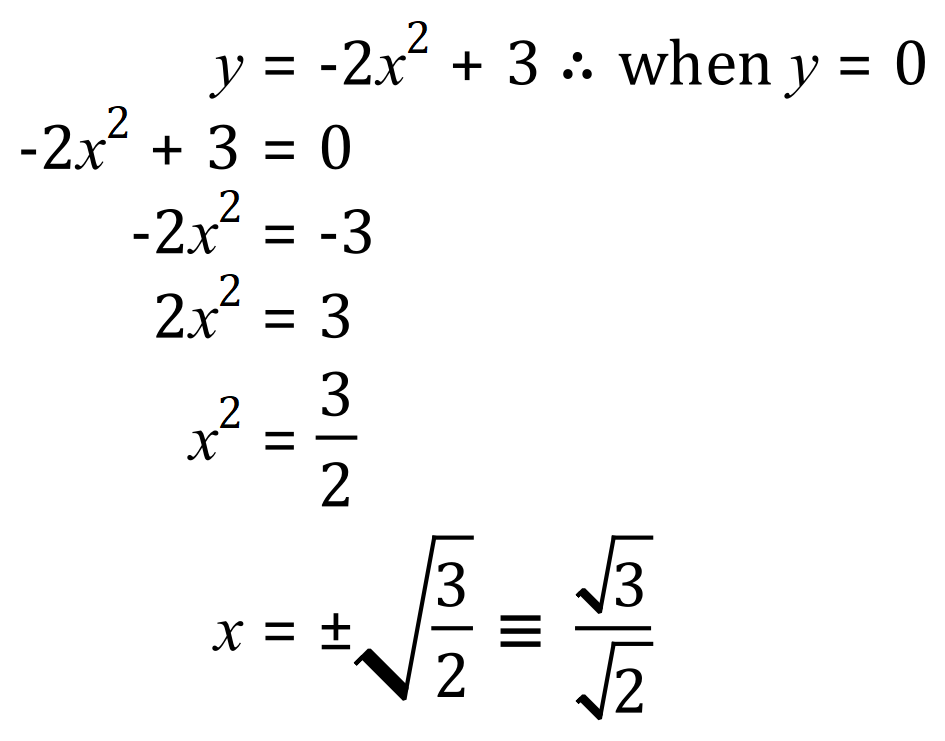
If you need a refresher on surds, click on the link >> Surds <<
Let us now take a look at a "typical" quadratic function, one that you might perhaps come across more often:
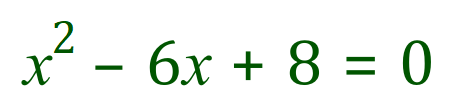
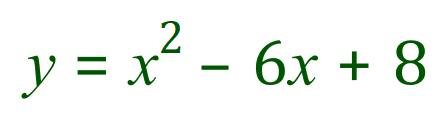
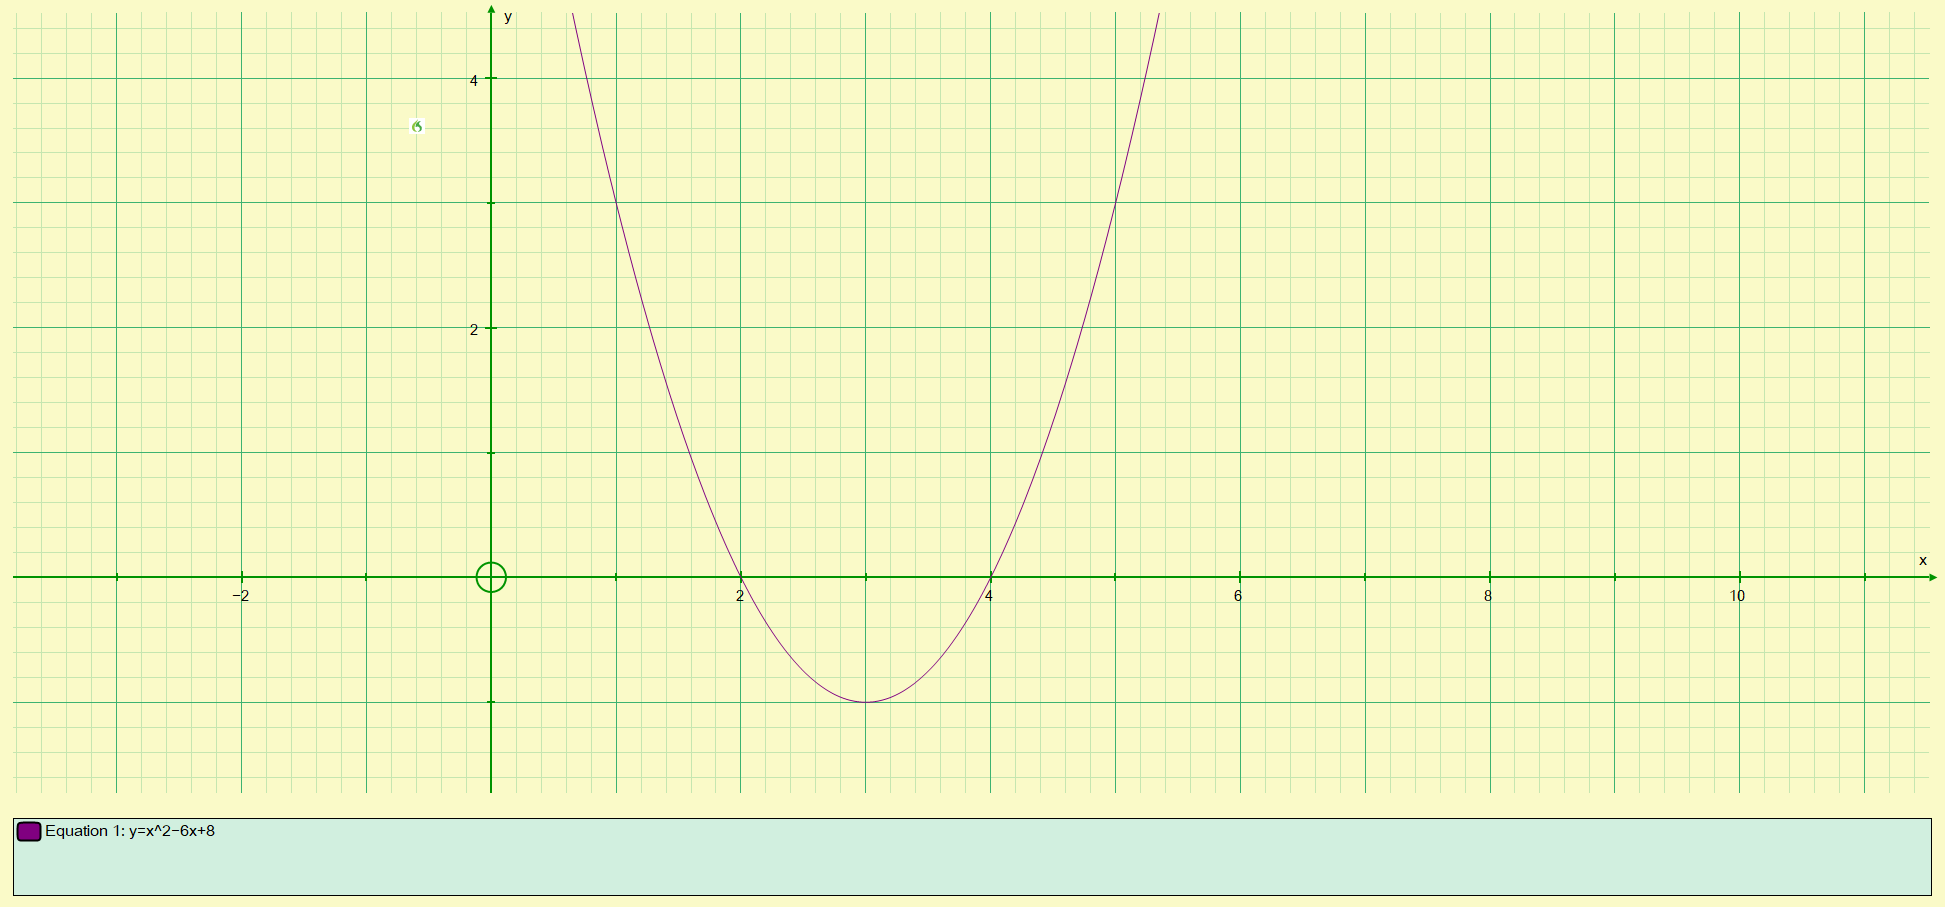
Again, this is a nice clean example where the "roots" of the function / equation are readily visible as 'x' equals +2 and 'x' equals +4. Substitution of either or both of these values into the equation will show that this is correct. The point at which the curve reaches its minimum (in this case at the coordinates (3, -1) is known as the "turning point" of the quadratic.
>> Questions <<