The Graph of "y = mx + c"
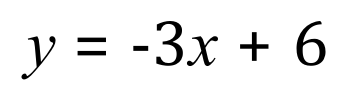
Q1. Given the equation:


(a) Complete the table and plot the equation on a graph
(b) What sort of graph have you plotted?
(c) What is the value of the gradient?
(d) Where will the line you have plotted cross the 'y' axis?
Q2. Given the equation:

(a) Complete the table and plot the equation on a graph
(b) What sort of graph have you plotted?
(c) What is the value of the gradient?
(d) Where will the line you have plotted cross the 'y' axis?
Q3. Complete the following table showing equations for 'y'. Plot these data on the SAME set of axes.
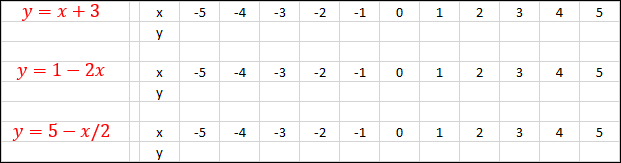
Click >> here << to see an example of how two straight line plots can be used on the same axes to solve a pair of Simultaneous Equations.
Go To >> Solutions <<
Back To >> The Graph of "y=mx + c"