Velocity-Time Graphs
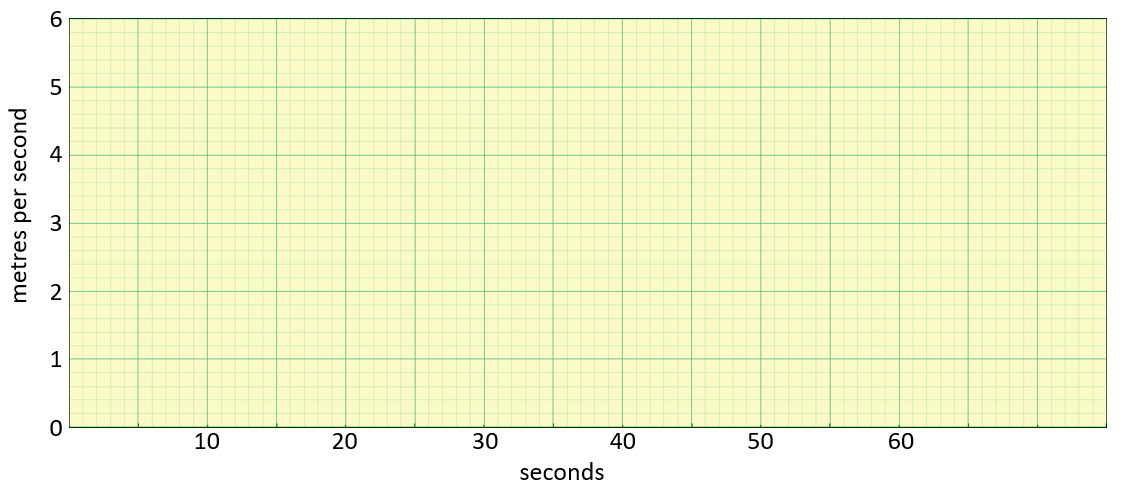
Question 1: A ball is placed at rest at the top of a hill. It travels with constant acceleration for the first 12 second and reaches a speed of 4 m/s. It then decelerates at a constant rate of 0.1 m/s2 for 20 seconds. It then travels at a constant speed for a further 18 seconds.
Draw a speed-time graph for the ball over the course of this 50 seconds.
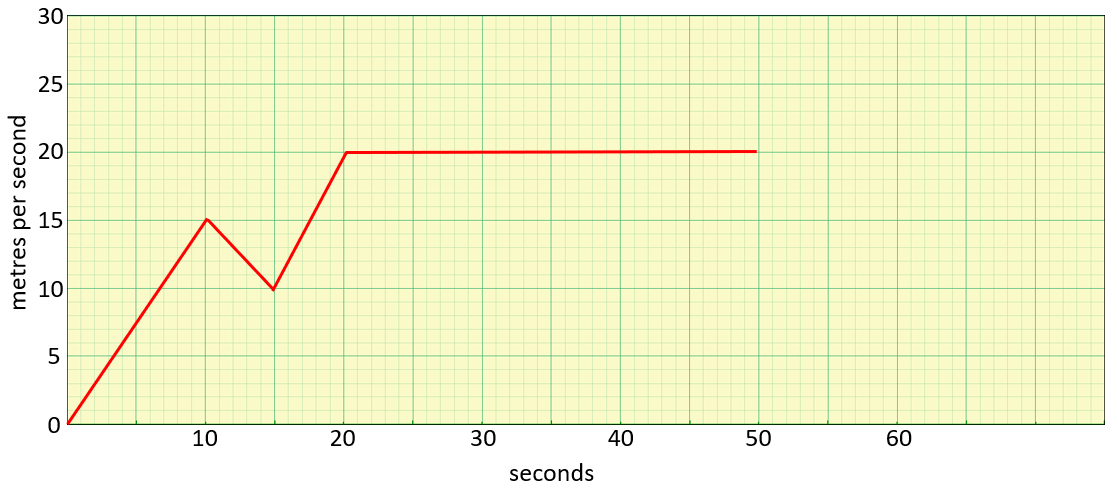
Question 2: Below is a speed-time graph of a track cyclist during a race. Work out the total distance travelled by the cyclist over the course of the race.
Question 3: A driver makes the journey represented by the graph shown.
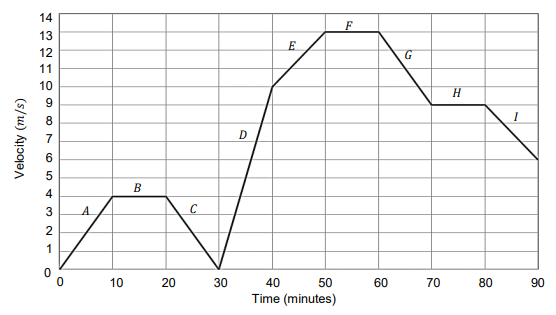
(a) Identify all of the sections of the journey where the driver is accelerating (not decelerating)
(b) When is the driver’s velocity constant?
(c) When does the driver have the greatest acceleration?
(d) In which two sections does the driver have the same acceleration?
Go To >> Solutions <<
Back To >> Velocity Time Graphs <<