Velocity-Time Graphs
A “velocity-time” or “speed-time” graph is a way of showing the details of a journey, as a representation of the speed / velocity variations (acceleration and deceleration), distance travelled and time taken.
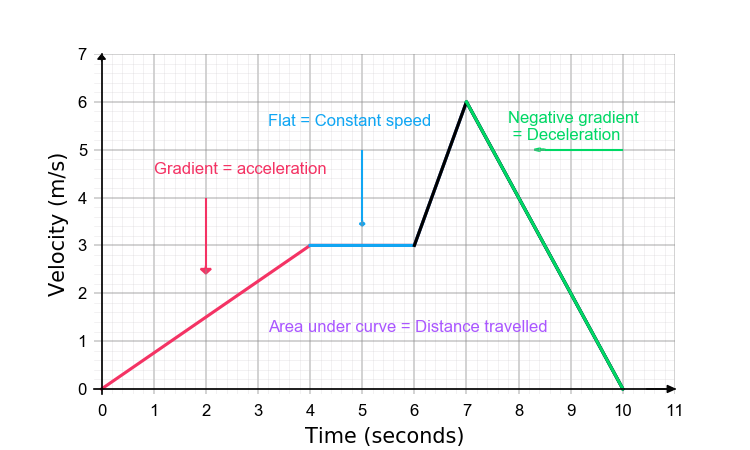
You need to be able to explain all of the features on the example graph above in order to fully understand velocity time graphs. Let's take a look at the features one by one, and working from left to right.
1. The red line has a positive gradient and shows the acceleration of the body, in this case from 0 up to a velocity of 3 m/s over 4 seconds. The gradient value will tell us the acceleration in metres per second per second.
In this case, the body reaches a velocity of 3 m/s in 4 seconds, with a constant acceleration of 0.75 m/s/s.
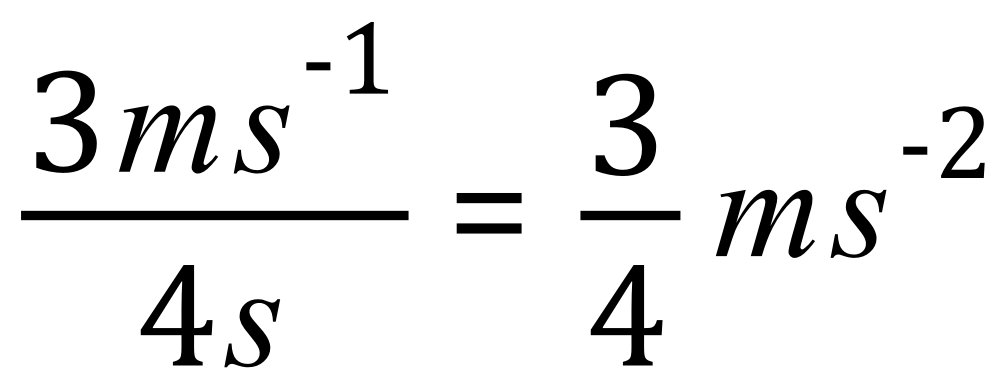
Another useful skill to develop is the ability to manipulate units as well as numbers. Metres per second divided by seconds gives us metres per second per second which are the units in which acceleration is measured.
2. The blue line shows that between 4 seconds and 6 seconds, the object does not change its velocity. This does not mean that it has stopped, it means that the velocity shown of 3 m/s is constant for the period.
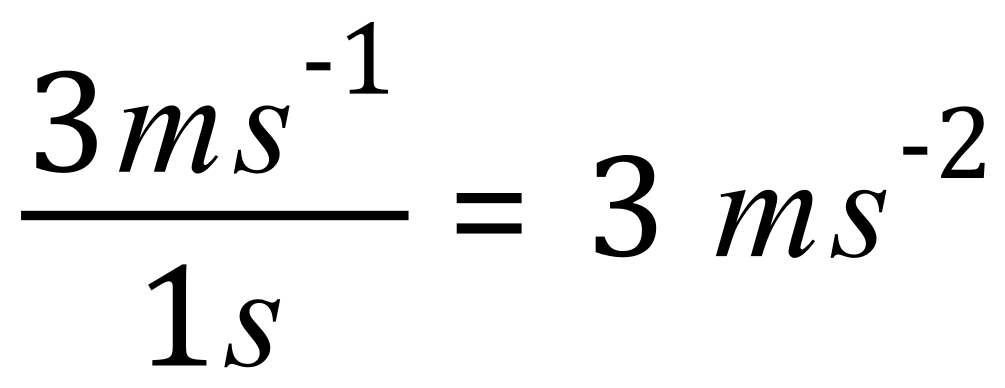
3. The black line shows between 6 and 7 seconds, there is a sharp acceleration from 3 m/s to 6 m/s. The steepness of the gradient tells us that the acceleration in this case was harder, an extra 3 m/s over one second tells us that the acceleration this time was 3 m/s per second:
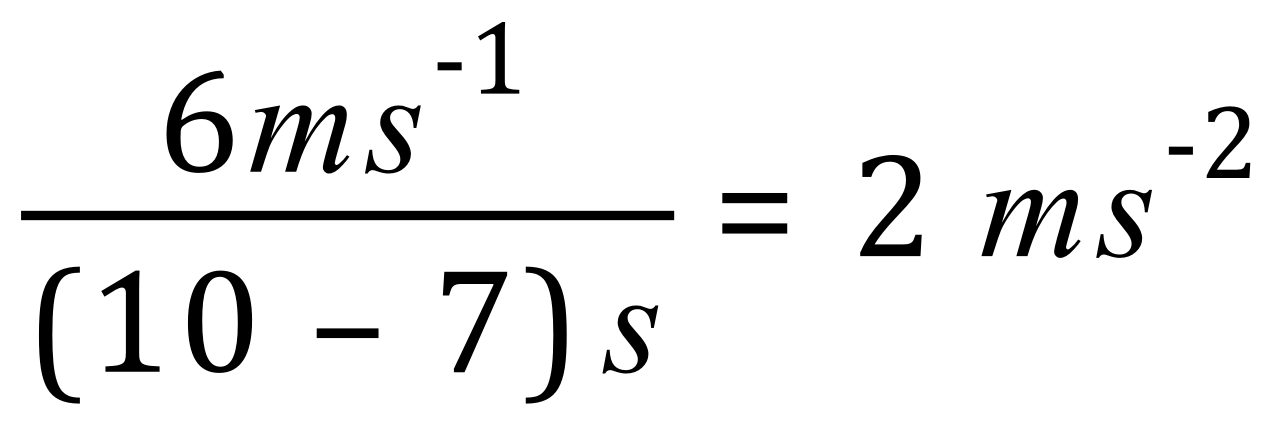
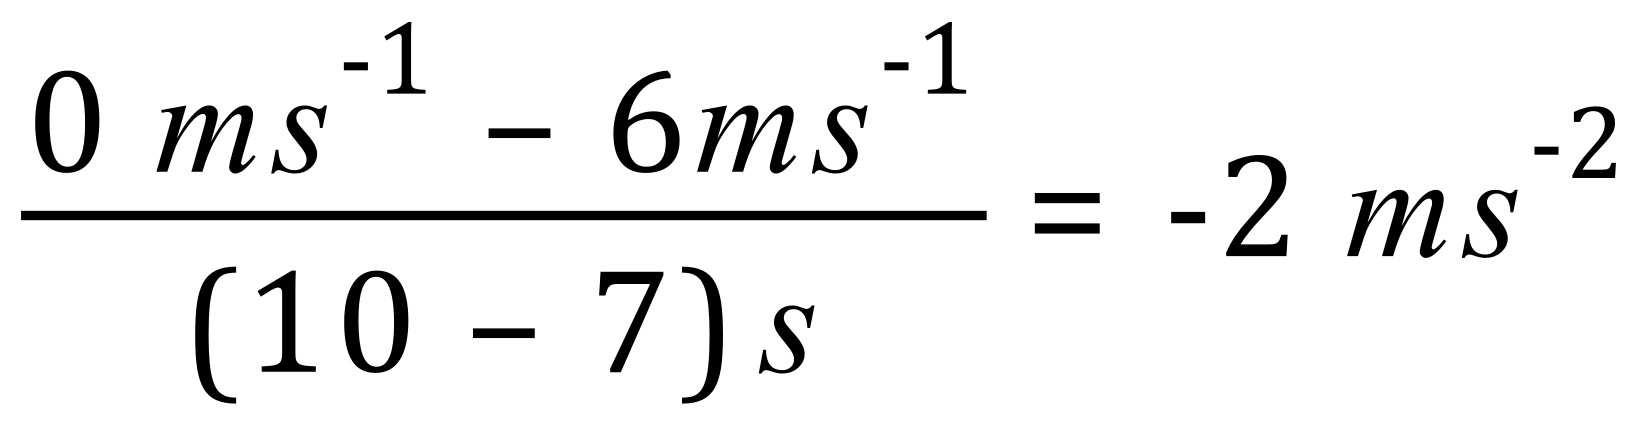
4. Finally, the green line which is a negative gradient represents "negative acceleration" which we refer to as deceleration. Over a period of (10-7) seconds the body decelerates from 6 m/s to 0 m/s, representing a deceleration of 2 m/s/s:
Sometimes this can be shown as final velocity - initial velocity over time, so a body changing its velocity from 4 m/s to 9 m/s over a period of 4 seconds which shown acceleration of 1.25 m/s/s.
Using this method, we can show our body represented by a green line in the graph as having a negative acceleration (which is in fact what deceleration is) by subtracting its initial velocity from its final velocity, in other words subtracting 6 from 0.
Now we have talked to this point about acceleration, deceleration and time but we would also be interested in the overall distance travelled by the body. This can be calculated by working out the area underneath the whole graph, or sections of it if we are only interested in distance travelled in a certain time.
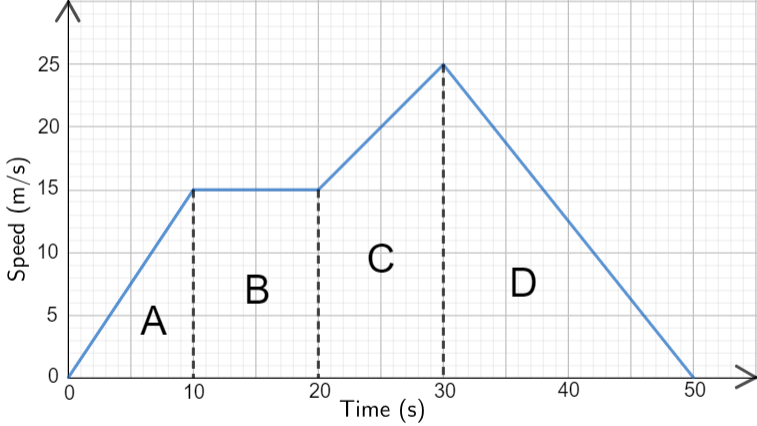
It may not be obvious to start with how this is going to work, but if we take a look at the section marked B to start with, it may be simpler. In the section marked B we can see that our body is moving at a constant velocity of 15 m/s, for a period of 10 seconds. If we multiply the velocity by the time, we can arrive at a distance according to the familiar speed/distance/time equation.
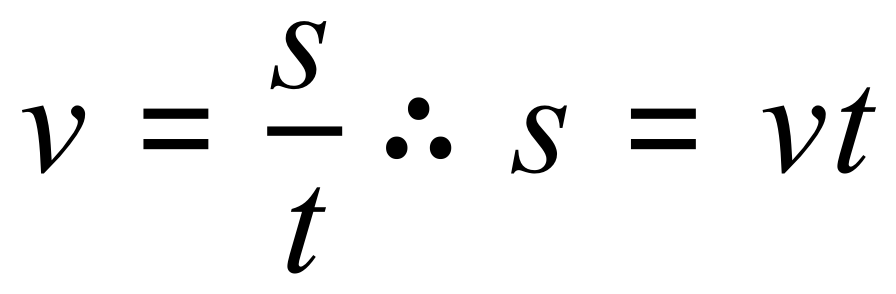
Where "v" is the velocity, in m/s, "s" is the distance in metres and "t" is the time in seconds.
Going back to our section marked B, we can see that the body travels at 15 m/s over a period of 10 seconds, in other words a distance of 150 m.
An understanding of how to calculate the area of a triangle will also be useful here, because it may be necessary in a number of cases to break down the area under the graph into squares, rectangles and triangles and to calculate their respective areas, summing them eventually to calculate the full distance travelled.
For example, if we consider the area marked A, and knowing that the area and a triangle is half of its base multiplied by its perpendicular height, we can establish that the body travelled a distance of 75m during this stage.
You should be able to work out for yourself, visually, that the distance travelled in section A is half of that travelled in B. Study the diagram to satisfy yourself that this is in fact the case.
Example:
What will be the full distance travelled by our body in this case?
To answer this question, we need to establish the distances covered in sections A, B, C and D and add them all together.
We already know that A is 75 m, and that B is 150 m. A little bit of manipulation will tell you that C is 200 m and D is 250 m, giving us a grand total of 75 + 150 + 200 + 250 = 675 m
>> Questions <<