Average Acceleration
Sometimes we need to establish an average for the acceleration, and sometimes you may need to know what the acceleration was at a specific instant.
An example of the first case could be an athlete running in a race over a fixed distance. At the starting line, when the starting pistol is fired, the athlete would be off quite quickly but is likely to drop slightly into a fixed velocity, this would not give us a linear graph, it would be more of a curve in the way that we would establish the average acceleration would be to measure the start velocity and the end velocity, calculate the difference between the two and divide by the time taken to cover that distance.
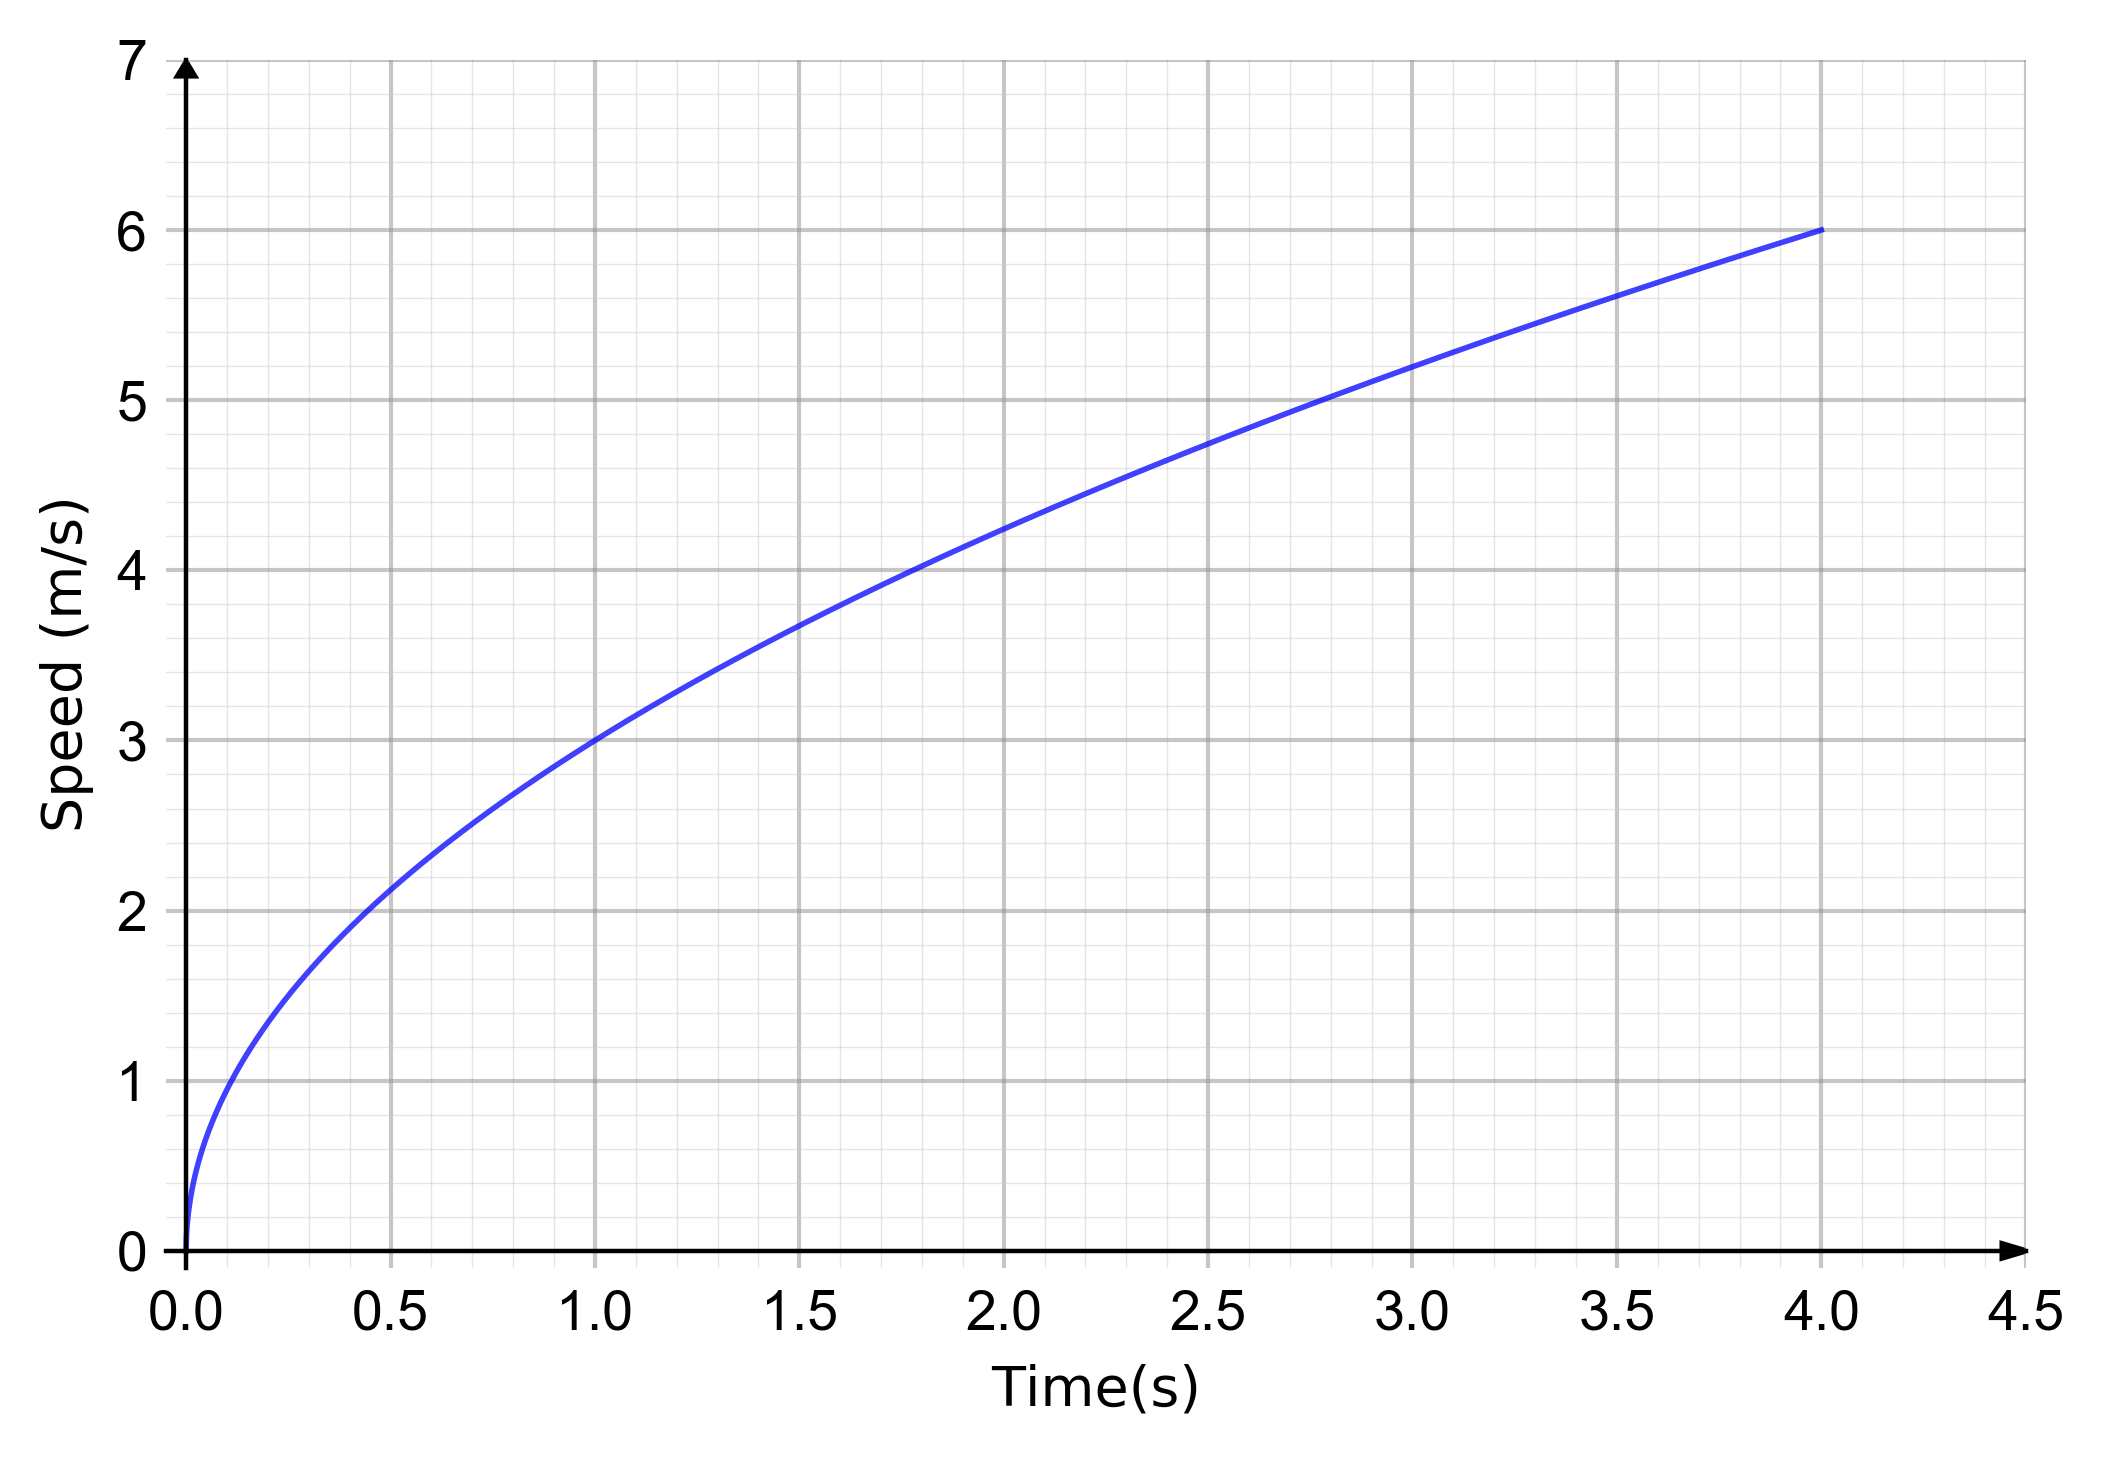
In the above curve, we can see that the initial acceleration was quite pronounced. The athlete had reached approximately 2.1 m/s in the first 0.5s but then started to slow down to a steadier pace. The average acceleration would be indicated here by drawing a line from the point (4.0, 6) back to 0 and calculating its gradient.
You should be able to see, in this particular case anyway without having to necessarily draw the line, that the gradient of a line between this point and 0 would be 6 ÷ 4 or 1.5 m/s/s.