Data Collection
Q1. Design tally charts that could be used to record the answers to each of these questions:
- How many siblings a person might have
- Mode of transport used to get to school and back
- A person's favourite type of fruit
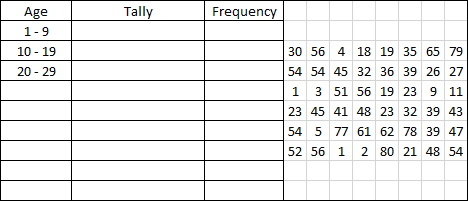
Q2. Here are the ages in whole years, of 48 people who attended the local accident and emergency department last weekend (a two day period). Copy and complete the grouped frequency table using groups of ten years for the rest of the table.
Go To >> Solutions <<
Back To >> Tally Charts <<