Tally Charts
So how do we collect data? Well, this depends to a certain extent on whether you are going to be collecting discrete data or continuous data. The collection methods may be similar, for example surveys, interviews and questionnaires but the way in which you tabulate and analyse the data will be different.
Let's take a couple of examples, first of all, let us look at a survey of 200 people, obtaining from them the age they were at their last birthday. To make sure that the sample is fair, your selection of population should span a wide range so you may consider from birth to, say 80 years old.

The tally is just for you to put quick check marks against the appropriate range, the frequency is just the total of the tally marks for each range. The reason we do this is simply for speed, for example if you are standing on a street corner counting the number of cars going past of a certain make, it is easier to make a tally chart of the makes your interested in and put tally marks each time a particular make goes past, rather than have to try to write in the make every time.
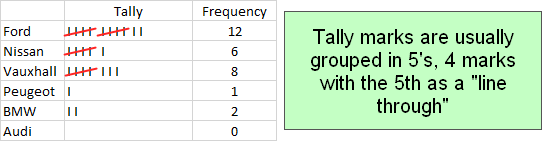
You can probably see that it would be simpler to collect your data this way, rather than try to write "Vauxhall" or "Peugeot" quickly in succession. The tallies are simply "totted up" at the end of the survey to produce the frequency.
>> Questions <<