Data Collection
A1.
- How many siblings a person might have is quite straightforward, but we need a sensible cut-off value. Although it is possible someone may have nine brothers and sisters, we may consider stopping at about four, and adding a final category of "more than four".

- Modes of transport could involve a tally chart something like this:
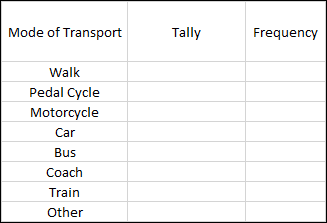
It should perhaps be mentioned that the categories you select should be thought through carefully. For example you may or may not want to make the differentiation between bus and coach, in which case bus could include coach and remove the need for a separate category. The category "other" is always useful as a "catch-all" because you might not want to have to include those people who skateboard, rollerskate et cetera :-)
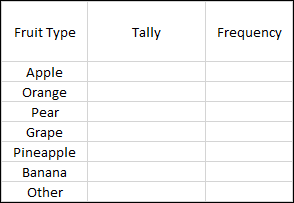
- A person's favourite type of fruit could be catered for by a chart something like this:
A2.
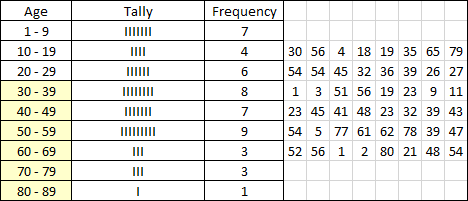
Remember that when your tally reaches a value of five, you should use the fifth tally mark to strike out the first four, then start a new set of marks. This way you will put your tally data into groups of five which will make it easier to calculate the frequency later.

Back To >> Questions <<
Back To >> Tally Charts <<