Graphing
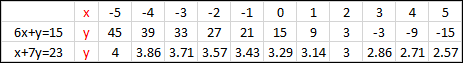
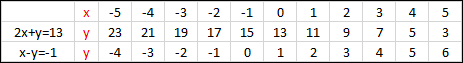
In these questions don't forget that the equations must be transposed in terms of 'y' to establish the corresponding value in the table.
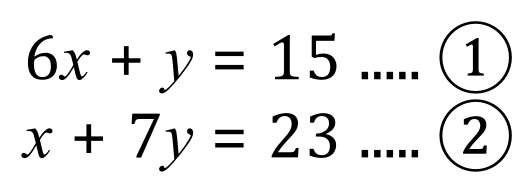
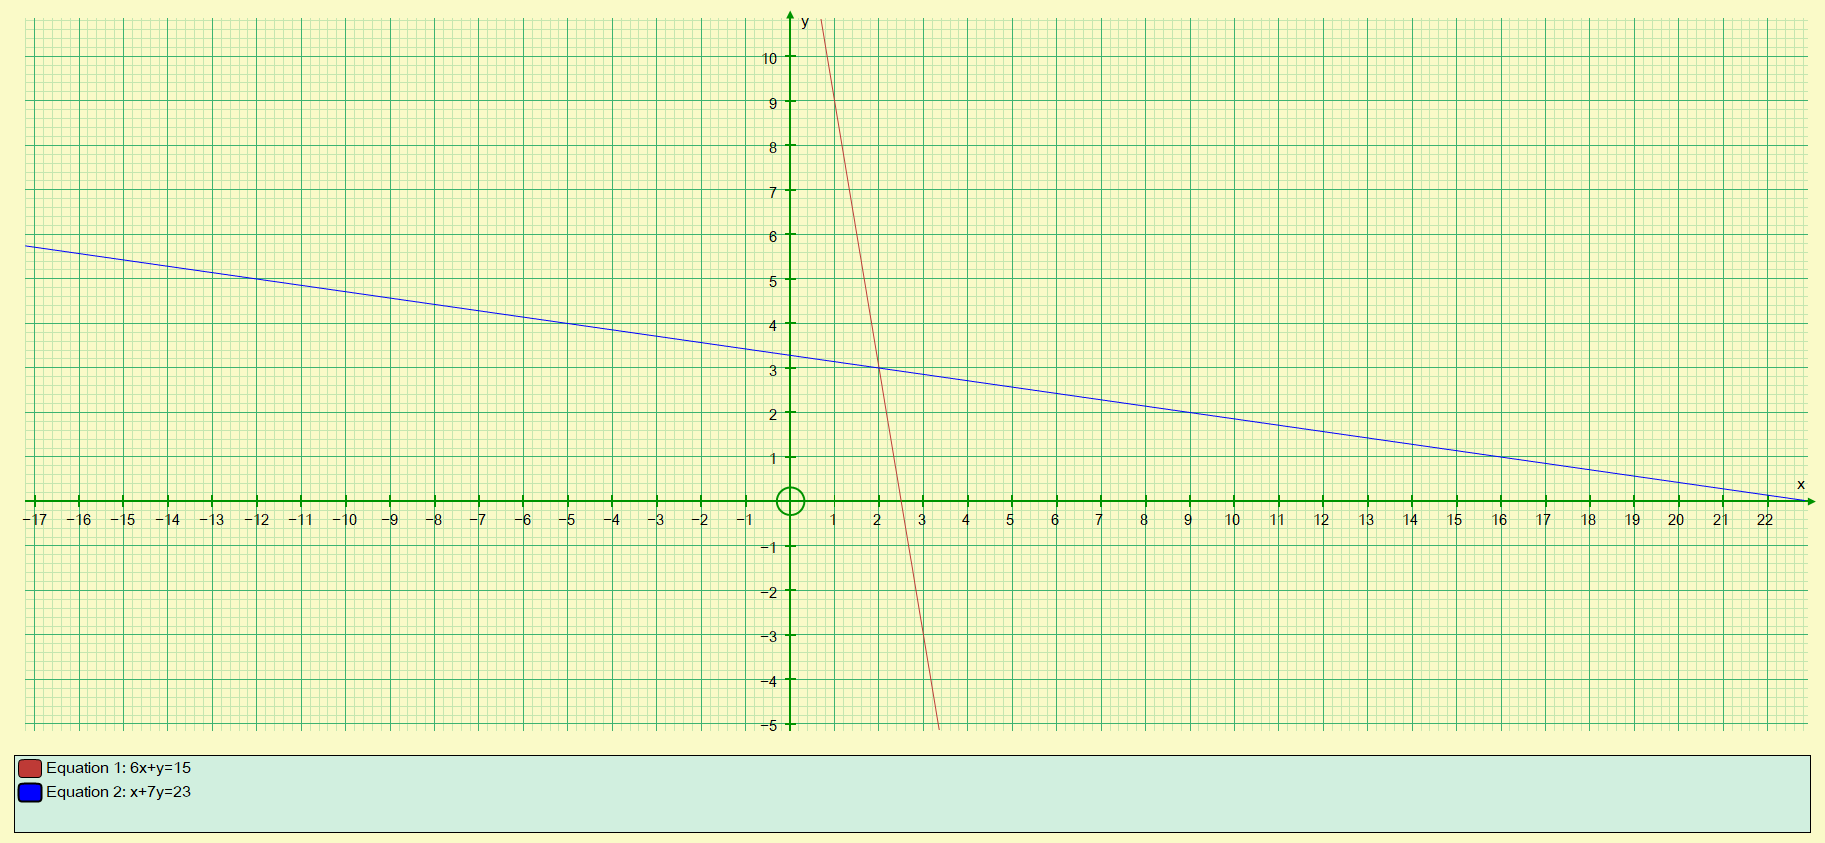
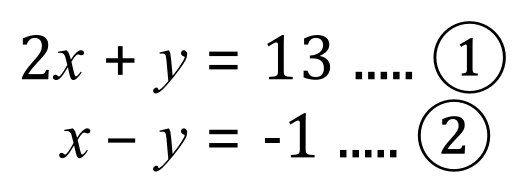
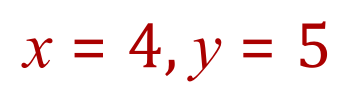
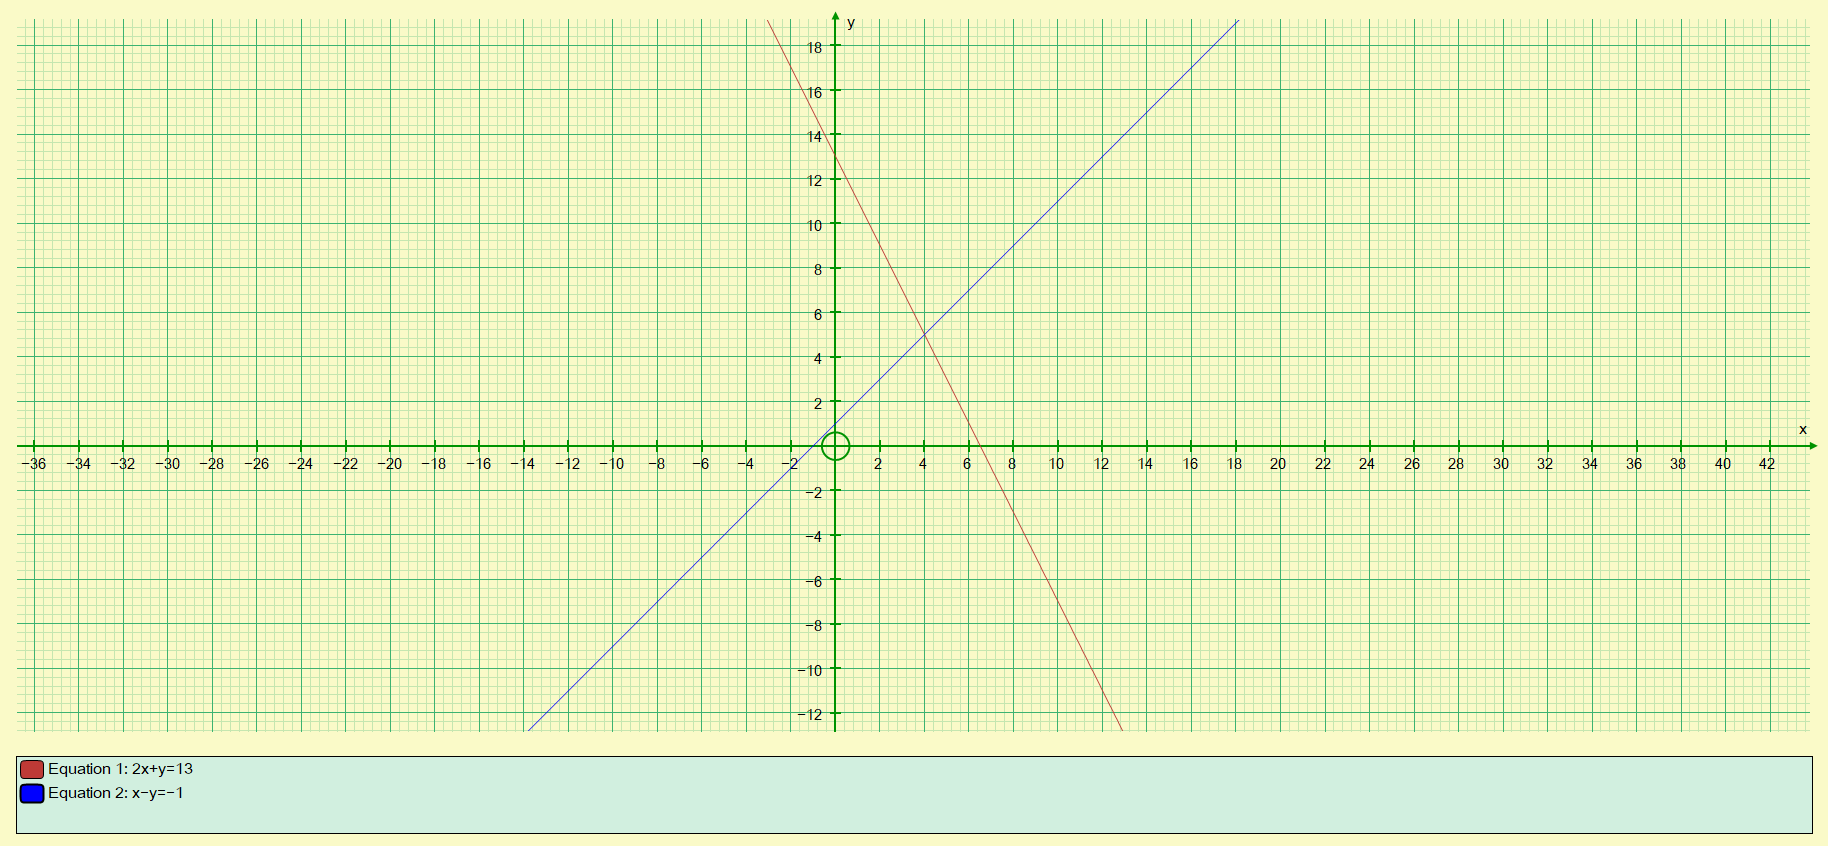
Q1. Solve the simultaneous equations shown below by graphing, establish the values for 'x' and 'y' where the plotted lines intersect.
Q2. Solve the simultaneous equations shown below by graphing, establish the values for 'x' and 'y' where the plotted lines intersect.
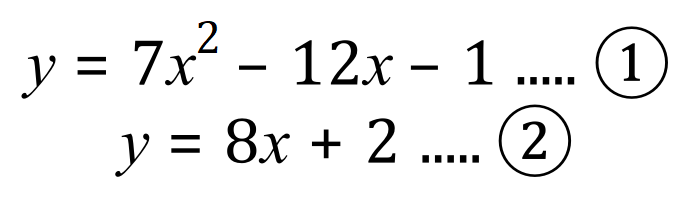
Q3. Solve the simultaneous equations shown (which were solved previously by substitution) below by graphing, establish the values for 'x' and 'y' where the plotted lines intersect.

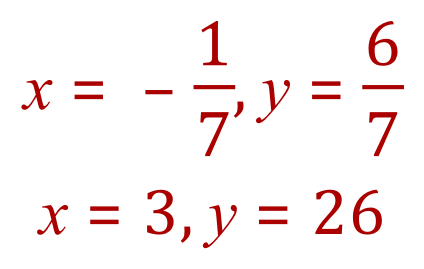
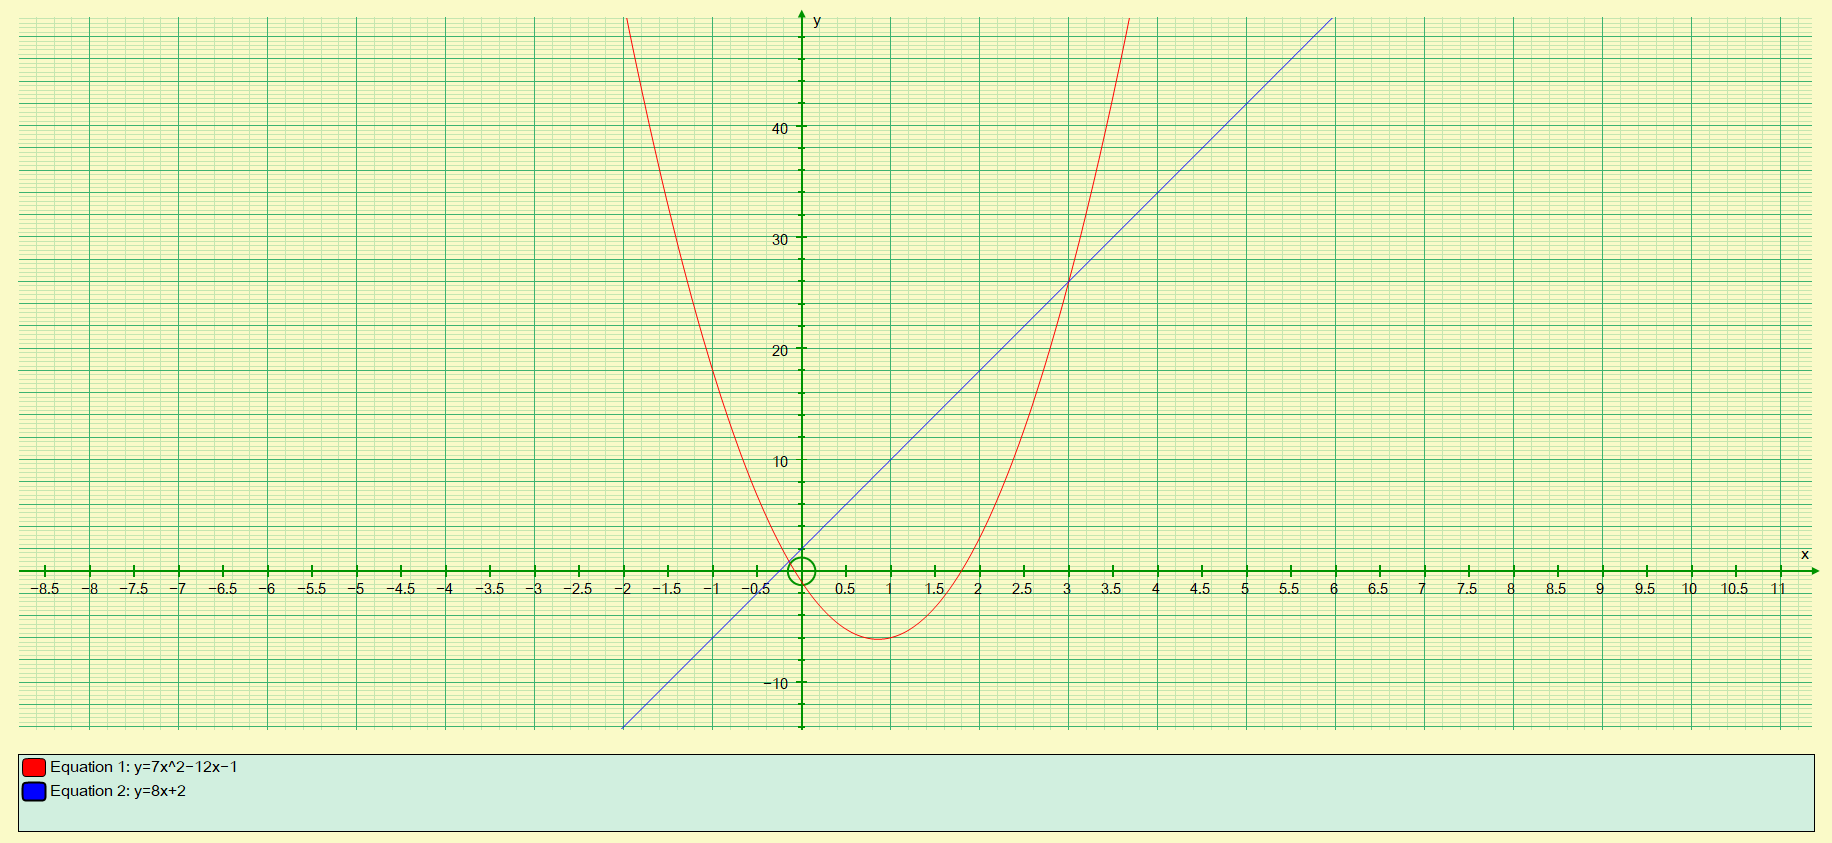
Notice that in the third example, one pair of values is quite prominent ('x' = 3, 'y' = 26) but the second set of values isn't quite so obvious. In the table I highlighted a cell in yellow which indicates where the second set of values would be found. If the value of -0.142 is entered into the equations, you will get back corresponding 'y' values of 0.85 and 0.86 to 2 decimal places. This has been done deliberately to show you where the second set of values would lie.
This particular problem (question 3) turned out to be a little bit more problematic than I intended, and would not be an ideal candidate for graph solution, however I have left it in to show how a graphical solution would be just as effective as a solution by substitution or elimination.
Back To >> Questions <<
Back To >> Simultaneous Equations by Graphing <<