Tree Diagrams
Tree diagrams are a visual way of showing all possible outcomes of two or more events.
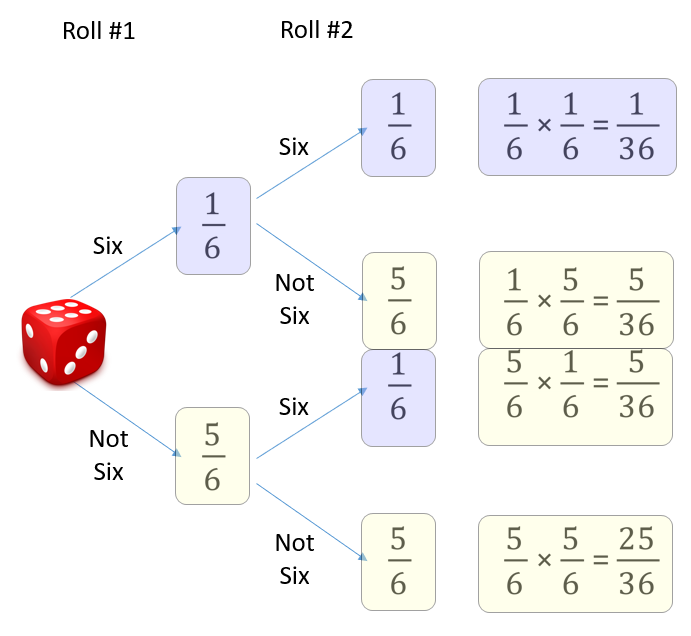
Each branch is a possible outcome and is labelled with probability. If a die was to be rolled twice, a tree diagram can show the probability of a 6 being rolled at each attempt. The tree diagram would look like the one below:
Question
|
A bag contains 4 blue counters and 3 red counters. |
|
|
|
|
|
|
|
|
|
|
|
|
|
A box contains 5 blue counters and 2 red counters. |
|
|
|
|
|
|
|
|
|
|
|
|


Complete a tree diagram and work out the probability of selecting two red counters.
Solution

You can see that the probability of RED on both occasions is: