Rates of Reaction
Q1. A student reacts Magnesium with five different concentrations of Hydrochloric Acid, as shown in the data table. The time (in seconds) for Hydrogen gas to stop being produced is also shown.
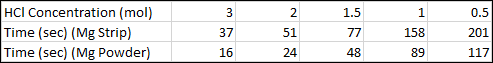
(a) On the same graph plot both sets of data, Hydrochloric Acid concentration vs Time.
(b) Give an explanation of your interpretation of the data, does there appear to be any correlation between surface area and rate of reaction?
Q2. In the "downward displacement of water" method of measuring the reaction rate of this particular reaction, it is important that the amount of hydrogen gas produced does not exceed the capacity of the measuring cylinder used to capture it. If this was allowed to be the case, there would be no way to accurately measure the data once the measuring cylinders volume had been exceeded.
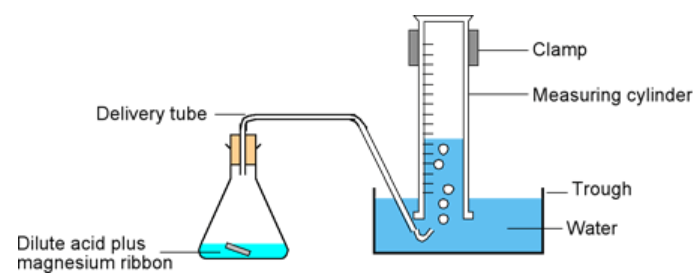
Explain how this experimental error could be avoided with consideration to how much Magnesium metal is actually used.
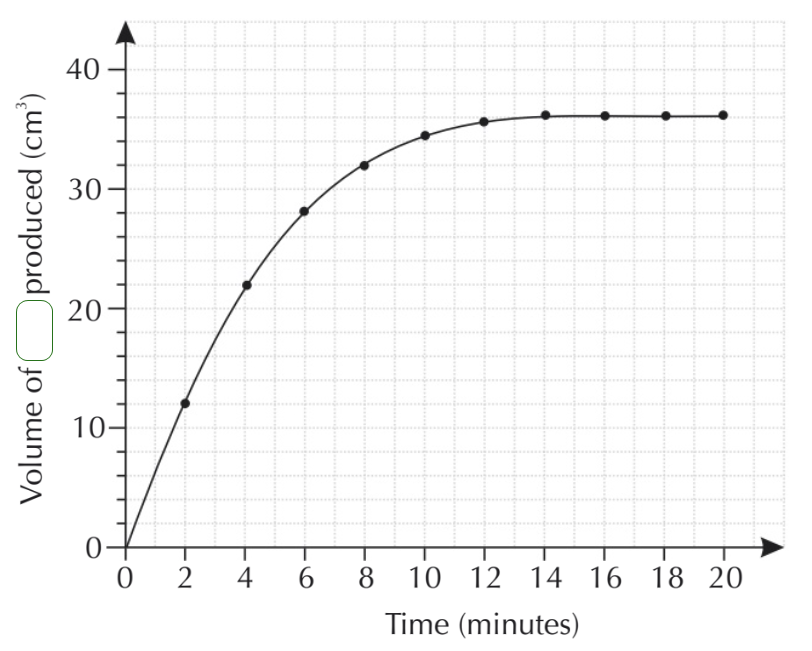
Q3. A student conducted an experiment using Hydrochloric Acid and Calcium Carbonate to study the rate of reaction by evolution of a certain gas. The data was collected and from this a graph produced:
(a) Name the gas produced in this reaction, and show the balanced chemical reaction with state symbols:
(b) From the graph, state how long it took for the reaction to complete.
(c) What was the rate of reaction, in cm3 per minute on the third reading?
(d) Give a brief explanation as to why the reaction slows down as time progresses.
(e) The student repeats the experiment by keeping the mass of Calcium Carbonate constant, but reduces the concentration of the Hydrochloric Acid by half although it remains in excess. Another curve is plotted and the same axes are used, the student notices that although the curve is not a sharp the first one the same amount of carbon dioxide is produced as the curve levels out at the same place (the curves overlap). Explain why this is?
Go To >> Solutions <<
Back To >> Measuring Rate Of Reaction <<