Scatter Graphs
Q1. Five well-known petrol stations record the total number of litres of unleaded petrol sold per day for a period of seven days. Information was recorded against the average cost of 1 litre of petrol:

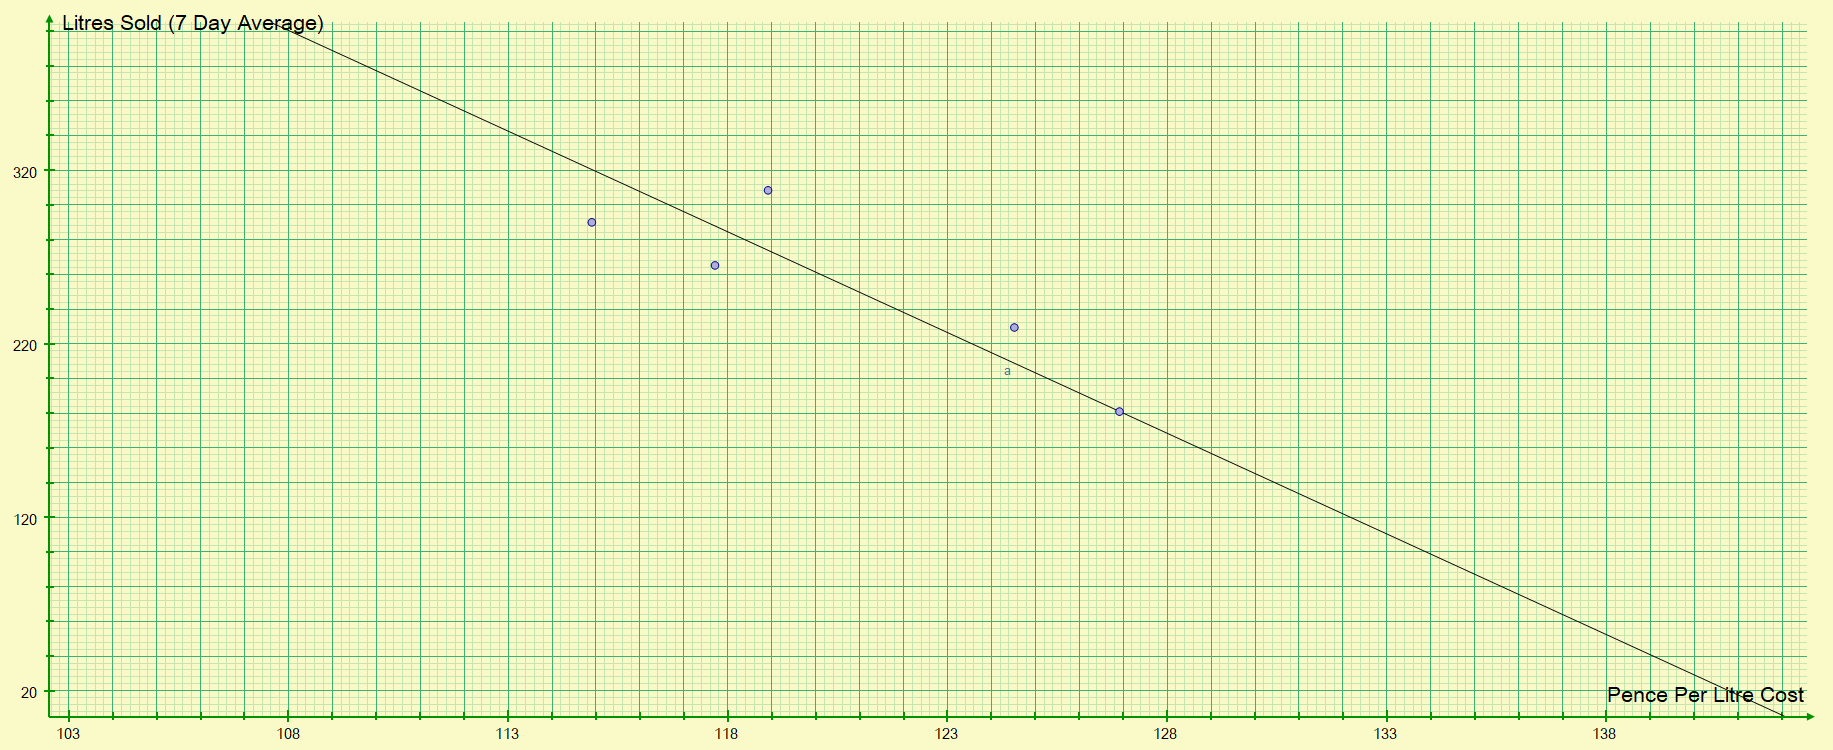
The average daily sale was recorded over this seven-day period and compared to the price per litre being charged. Plot the data on a scatter graph and establish any correlation, positive or negative and explain your reasoning.

Looking at the amount of petrol sold against the cost per litre from each garage there is a very weak/moderate negative correlation which would suggest that as the price of the petrol increases, the number of litres sold at that location per day on average would decrease.
I would state that this is roughly what you would expect to see, in general motorists will use petrol stations which offered the cheapest fuel but of course there are some occasions when they have no choice (such as running low on or near a motorway where petrol prices tend to be that little bit higher).
Q2. A survey was conducted across 100 patients at a local general practitioner as to how many times approximately a year they attend medical appointments. The hundred patients were split into "decade" age brackets and the results compiled thus:


The information shows a moderate positive correlation which tends to suggest that as the age of the patient increases, so does the likelihood that the person may need medical appointments more often. I would state that this is not an unreasonable conclusion to reach.
Q3. Consider the following pairs of variables, and decide for yourself whether or not they are likely to show positive or negative correlation, or no correlation whatsoever. Explain your reasoning:
- The outside temperature and sales of ice cream.
There would likely be a positive correlation here, as the outside temperature increases then the sales of ice cream is likely to do the same.
- The outside temperature and sales of hot chocolate drinks.
This is likely to show a negative correlation, as the outside temperature increases the sale of hot chocolate is likely to go down, conversely as the temperature drops the sales are likely to go up.
- The outside temperature and bread sales.
There is unlikely to be any correlation here, it is hard to imagine how the outside temperature (hot or cold, summer or winter) can affect the sales of bread!
- The age of a child and his/her height.
There is likely to be a positive correlation, as children get older and grow up they usually increase in height.
- The speed limit in the street and the average speed of cars as they drive down that street.
There is likely to be a positive correlation here, as the speed limit increases the average speed is likely to increase as most (but not all) drivers will approach or stick to the speed limit, some will of course exceed it but in any event as the speed limit increases the average speed is likely to do the same.
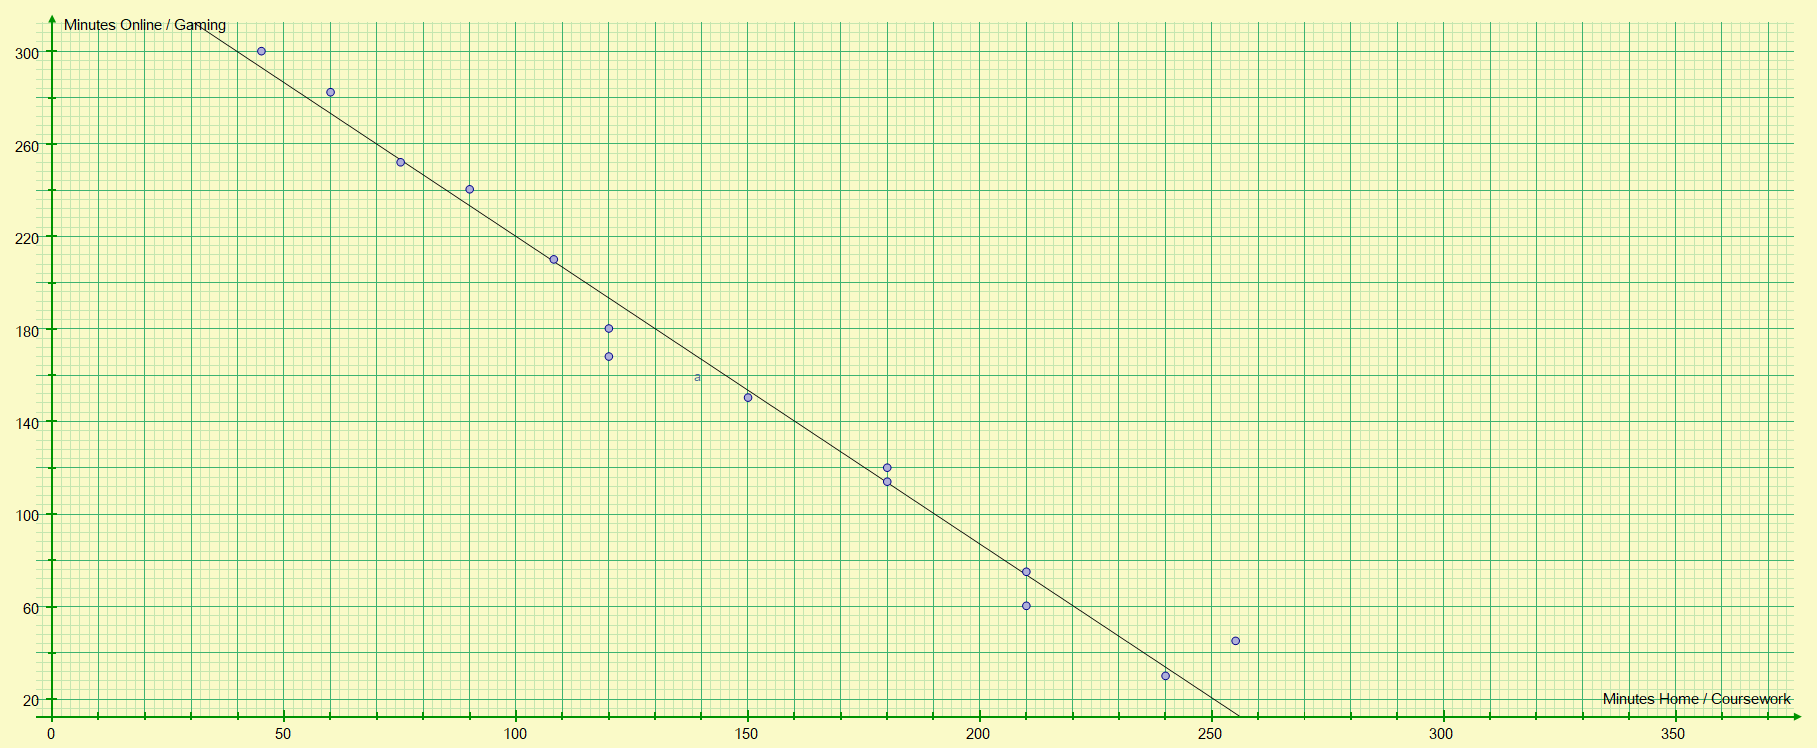
Q4. A survey was conducted of a class of 20 school pupils. They were asked how many hours on average a weekend they spend on the PlayStation / X - Box or on the Internet, and how long they spend completing schoolwork (homework / coursework).


As you can almost certainly see there is a very strong negative correlation between the length of time spent online/playing games and the length of time completing homework/coursework. As the length of time spent online increases the length of time spent completing homework decreases, and vice versa.
Q5. Ewan wants to buy a particular car and has visited the local used car plot. There are several available with different prices based on mileage and other things.

- Plot, on a scatter graph, the given mileages against screen price.
- Draw a line of best fit through your points

- Predict what a car might cost if it was on offer with a mileage of 7600 miles
£9000
- What type of correlation does your plot show?
The plotted data shows a moderate negative correlation.
- What statement can you make about car price as the mileage increases?
Based on the answer above I would state that the moderate negative correlation is supported by the fact that it would appear that as the mileage of the vehicle increases its value/sale price decreases.
Back To >> Questions <<
Back To >> Scatter Graphs <<