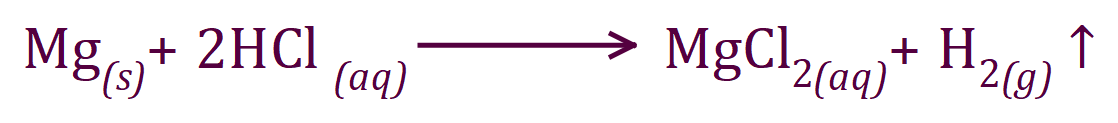
Magnesium and Hydrochloric Acid - Gas Evolution (Tangent To A Curve)
As you have seen the curves in the foregoing experiments have been quite convincing, irrespective of the concentrations of reactants used, all reactions will eventually come to an end. In the reaction between magnesium metal and hydrochloric acid, this phenomenon is quite prominent. Keeping the mass of magnesium used as a constant and varying the concentration of the acid used will modify the rate of reaction for reasons previously explained using collision theory. In an experiment conducted by myself in 2017, the following results were obtained:
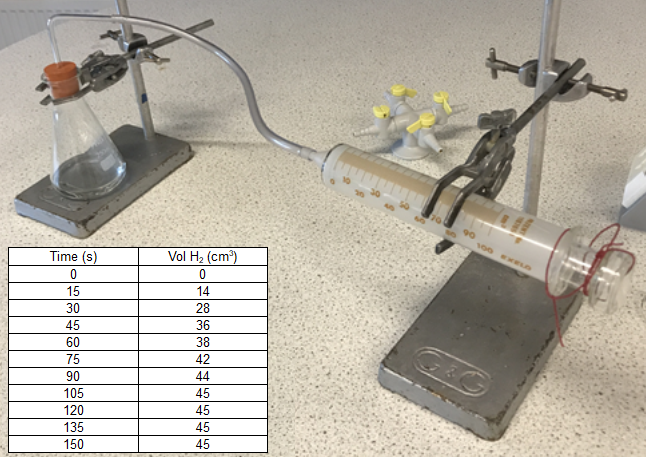
This particular example used a reasonably strong concentration of hydrochloric acid and as such you can see that the final volume of 45 cm³ was reached quite quickly. If we take the volumes of hydrogen gas produced, and plot them against time, we will obtain a curve which has a sharp gradient to start with but which slows down to a horizontal plateau at approximately 105 seconds.
This is because at this point the magnesium metal has been completely consumed, therefore no further hydrogen can be produced.
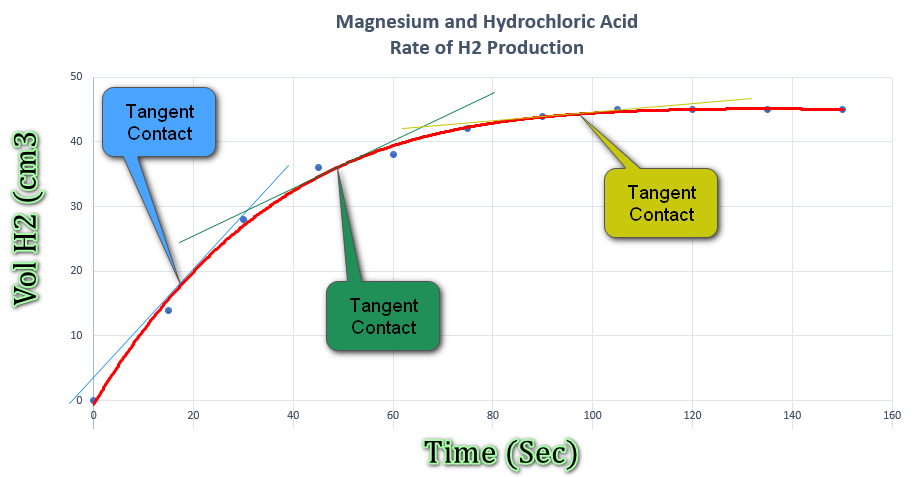
The line above shows that the reaction does in fact slow down as the magnesium is consumed, but what if we wanted to approximate the rate of reaction at any given point?.
On the curve I have drawn three tangents, one in blue, one in green and one in a mustard colour. The intention is that these tangents touch the curve at the points at which the reaction rate is to be approximated. Once the tangents have been drawn it's simply a matter of establishing the "rise" (distance up the y-axis) divided by the "run" (distance across the x-axis) to obtain the gradient of the tangent at the contact point. I have not calculated these for the three examples above, but by eye I would approximate the rate of reaction for:
- The Blue line to be approximately 18 cm³ at approximately 18 seconds.
- The Green line to be approximately 36 cm³ at approximately 48 seconds.
- The Mustard line to be approximately 44 cm³ at approximately 98 seconds.
If we divide the volume by the time for each of three we arrive at values of 1.0, 0.75 and 0.49 cubic centimetres of hydrogen gas per second, further (arithmetical) proof that the rate is in fact slowing down.
What we are looking at is the change in volume of gas produced, with respect to time by calculating the gradient (or slope) of a line at a given point. You will see more about this when you start to study differentiation in mathematics.
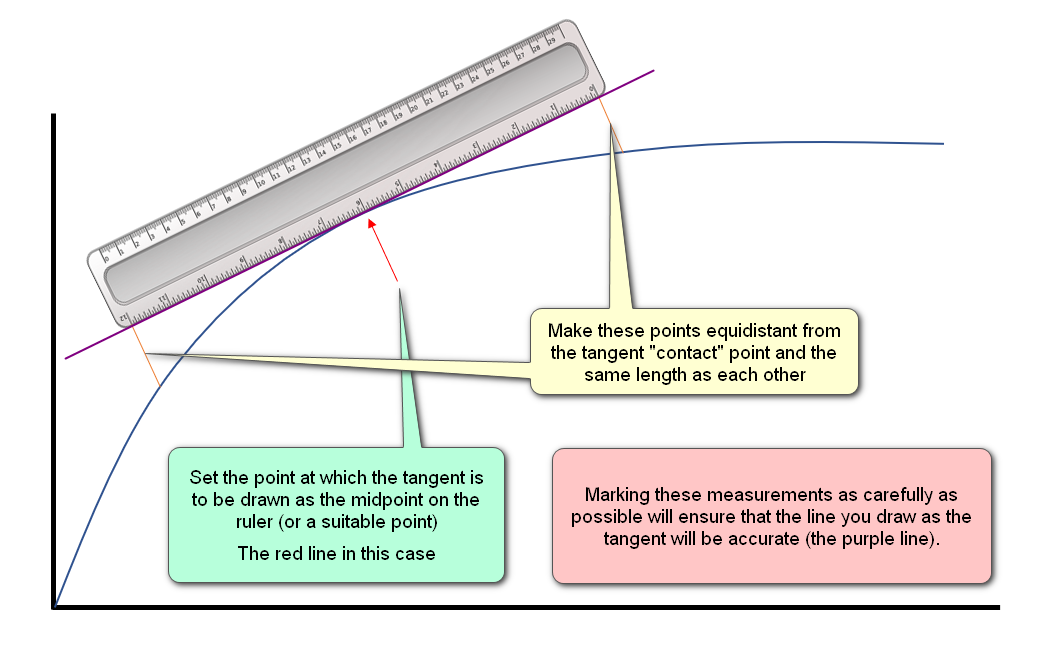
Practical Note:
Make sure that you correctly place your ruler when estimating the tangent, if you are "out" on this, your final calculation will suffer the error: